React 性能跟踪
React 性能轨迹是专门的自定义条目,显示在浏览器开发者工具的性能面板时间线上。
🌐 React Performance tracks are specialized custom entries that appear on the Performance panel’s timeline in your browser developer tools.
这些轨道旨在通过可视化 React 特定的事件和指标以及其他关键数据源(例如网络请求、JavaScript 执行和事件循环活动),为开发者提供对 React 应用性能的全面洞察,所有这些都同步在“性能”面板中的统一时间轴上,以便全面了解应用行为。
🌐 These tracks are designed to provide developers with comprehensive insights into their React application’s performance by visualizing React-specific events and metrics alongside other critical data sources such as network requests, JavaScript execution, and event loop activity, all synchronized on a unified timeline within the Performance panel for a complete understanding of application behavior.
用法
🌐 Usage
React 性能轨迹仅在 React 的开发和性能分析版本中可用:
🌐 React Performance tracks are only available in development and profiling builds of React:
- 开发:默认启用。
- 性能分析:默认情况下,仅启用调度器跟踪。组件跟踪仅列出封装在
<Profiler>的子树中的组件。如果启用了 React 开发者工具扩展,即使组件没有被<Profiler>封装,也会包含在组件跟踪中。服务器跟踪在性能分析构建中不可用。
如果启用,轨迹应该会自动出现在使用提供 可扩展性 API 的浏览器的性能面板记录的踪迹中。
🌐 If enabled, tracks should appear automatically in the traces you record with the Performance panel of browsers that provide extensibility APIs.
使用性能分析构建
🌐 Using profiling builds
除了生产和开发构建之外,React 还包括一个特殊的性能分析构建。
要使用性能分析构建,你必须使用 react-dom/profiling 而不是 react-dom/client。
我们建议你在构建时通过打包工具别名将 react-dom/client 别名为 react-dom/profiling,而不是手动更新每个 react-dom/client 导入。
你的框架可能内置支持启用 React 的性能分析构建。
🌐 In addition to production and development builds, React also includes a special profiling build.
To use profiling builds, you have to use react-dom/profiling instead of react-dom/client.
We recommend that you alias react-dom/client to react-dom/profiling at build time via bundler aliases instead of manually updating each react-dom/client import.
Your framework might have built-in support for enabling React’s profiling build.
跟踪
🌐 Tracks
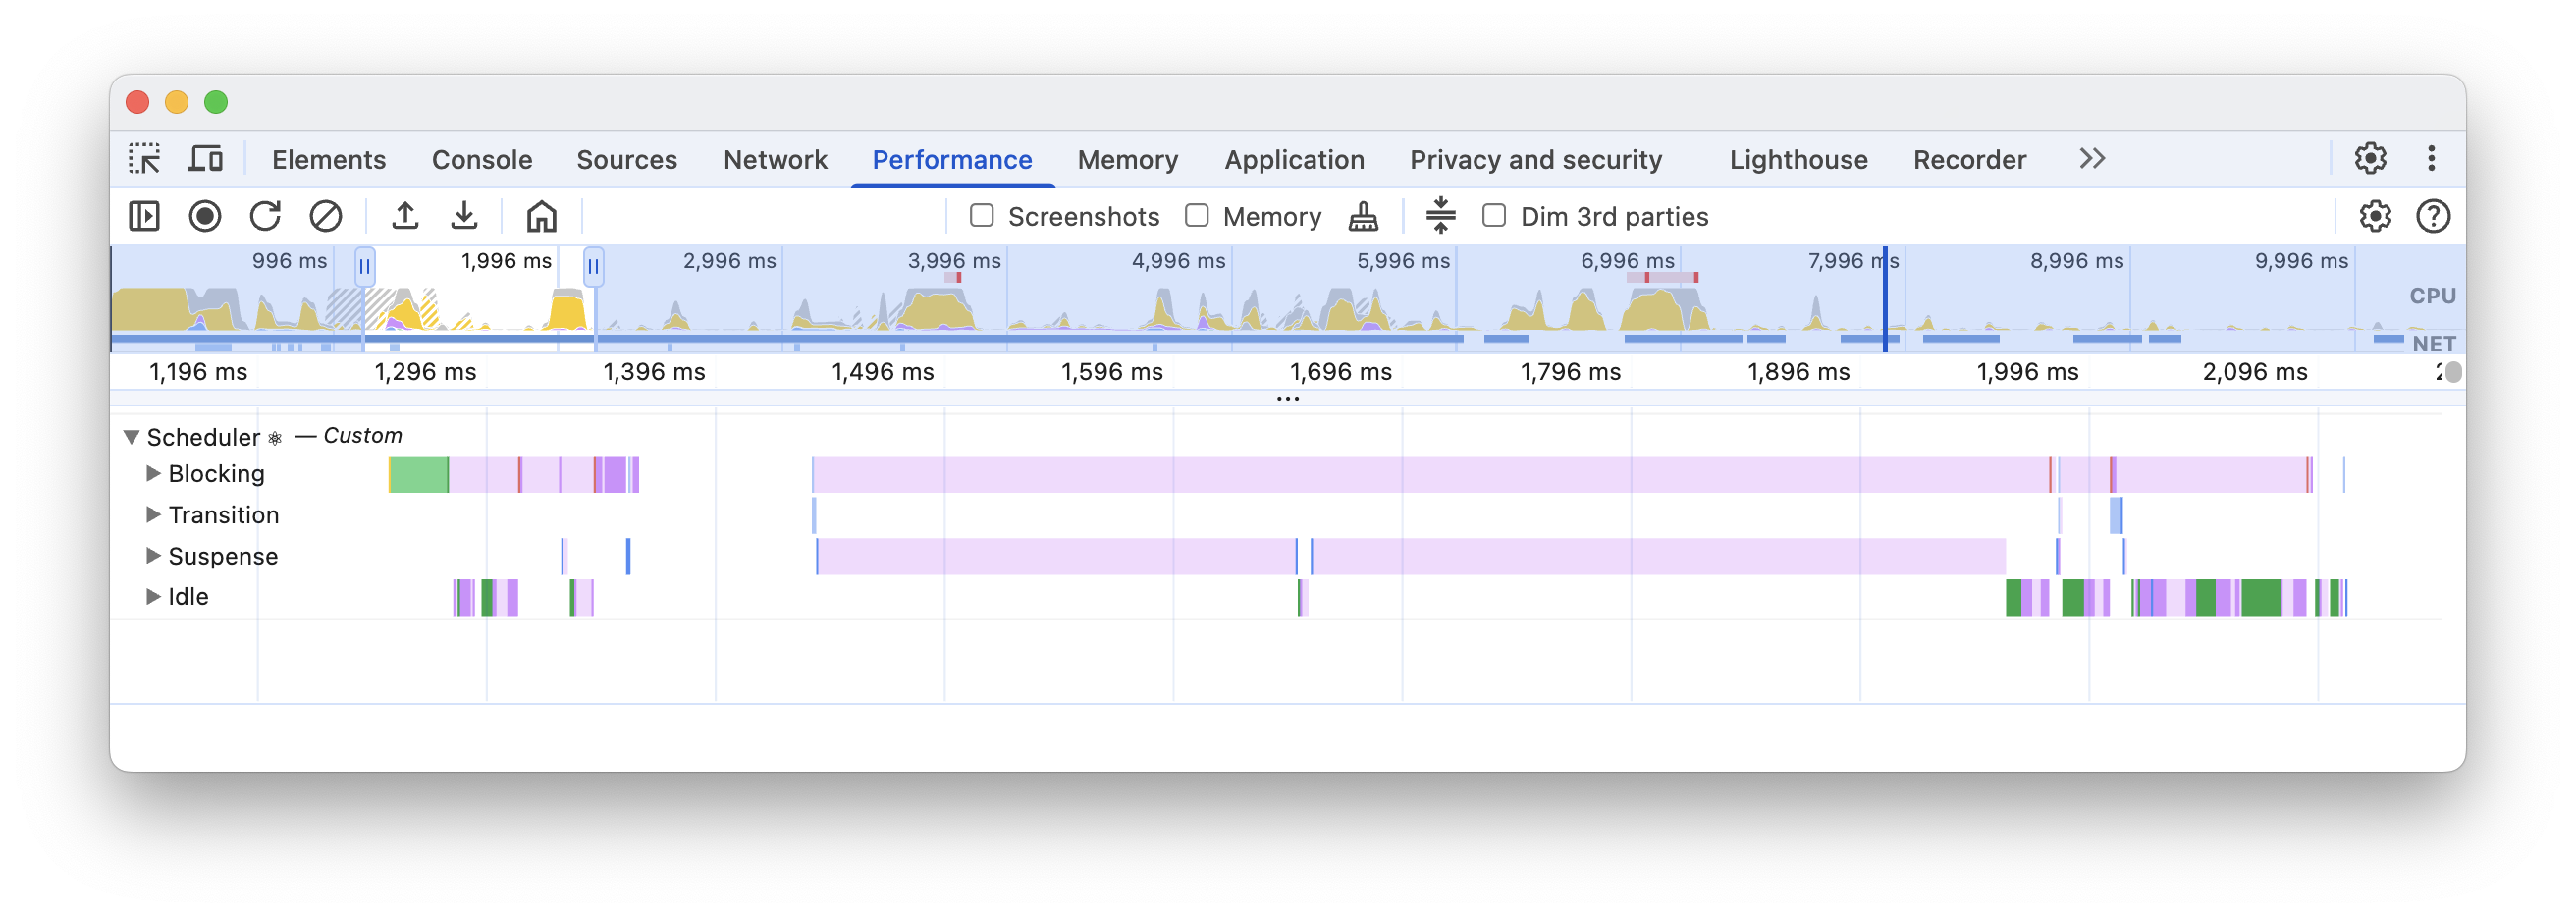
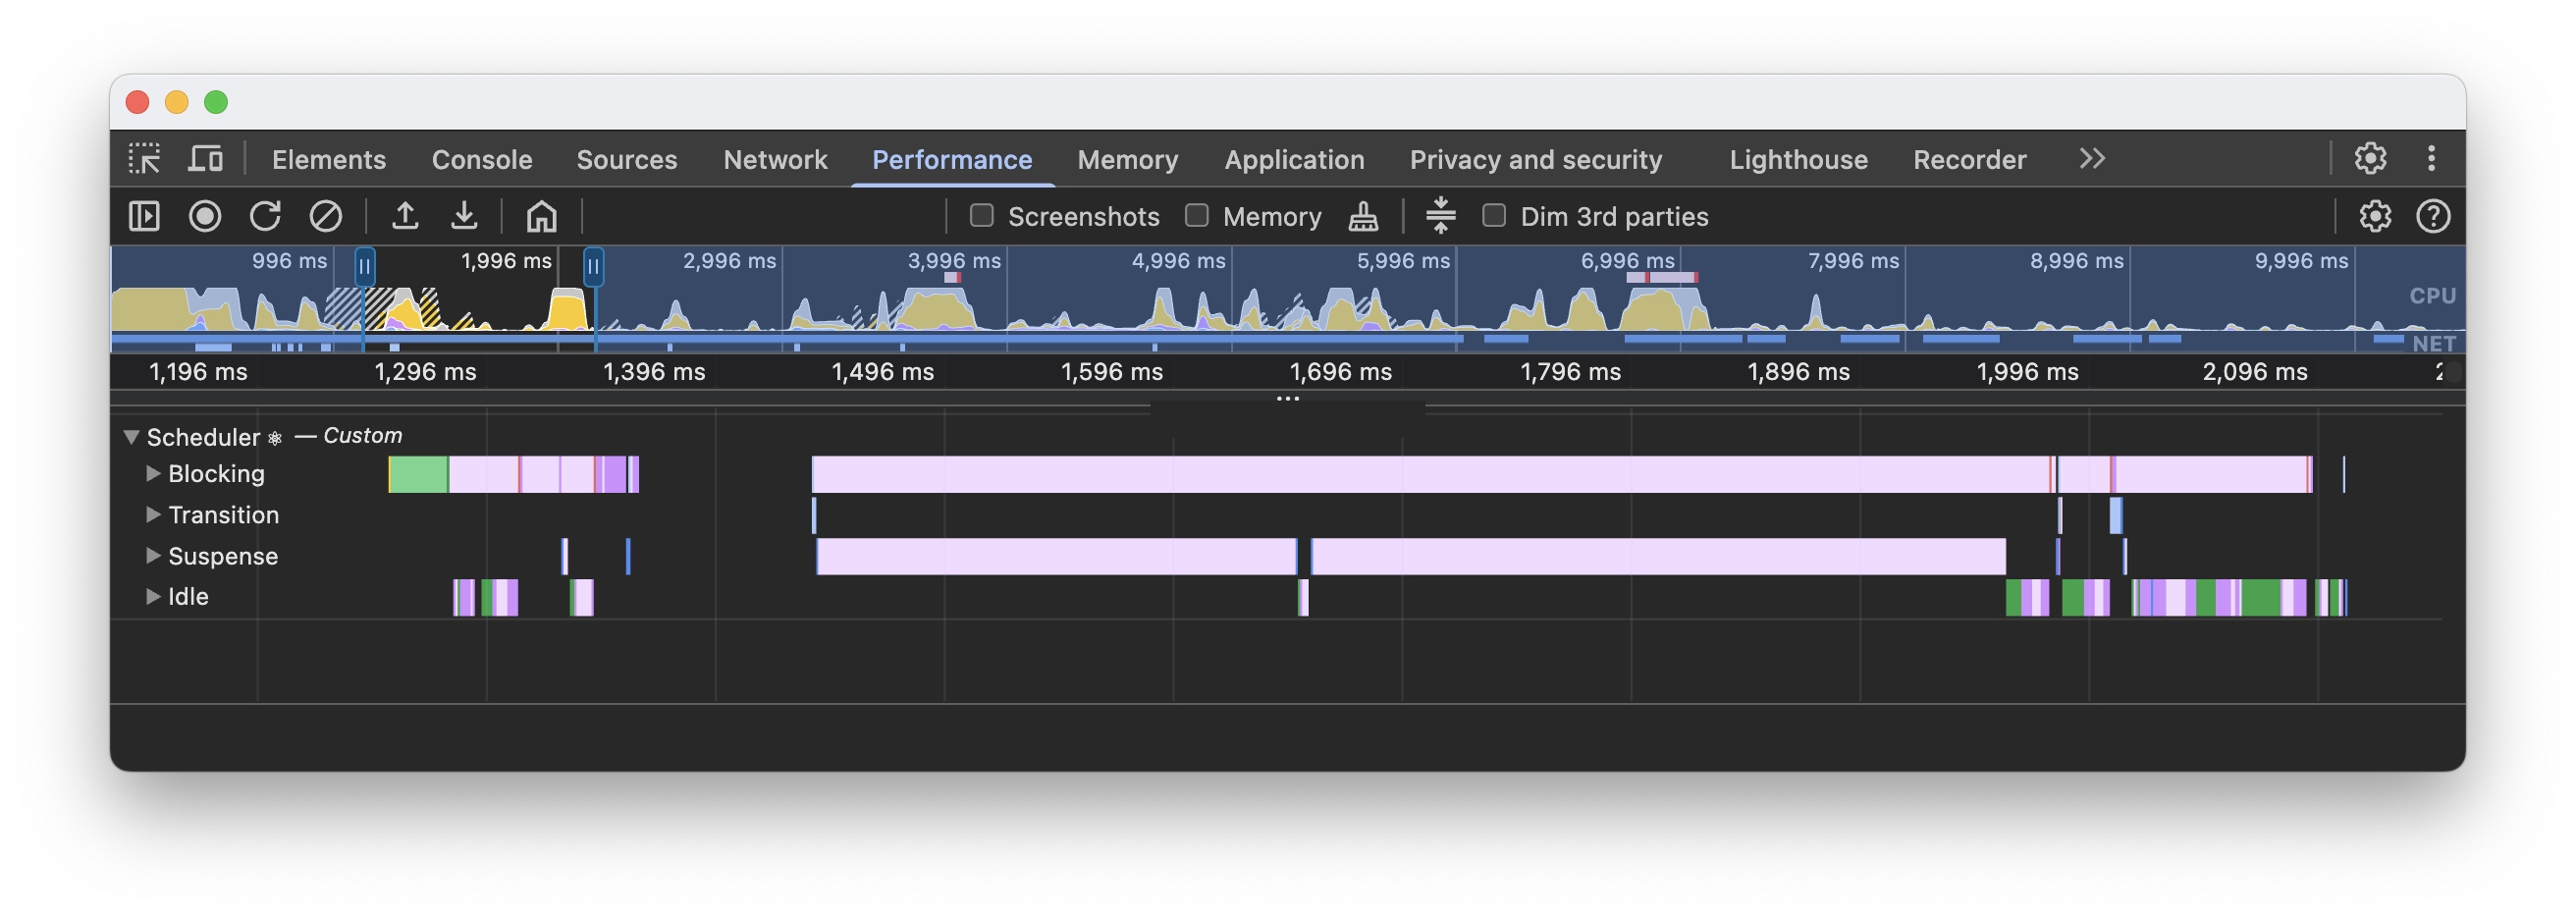
调度程序
🌐 Scheduler
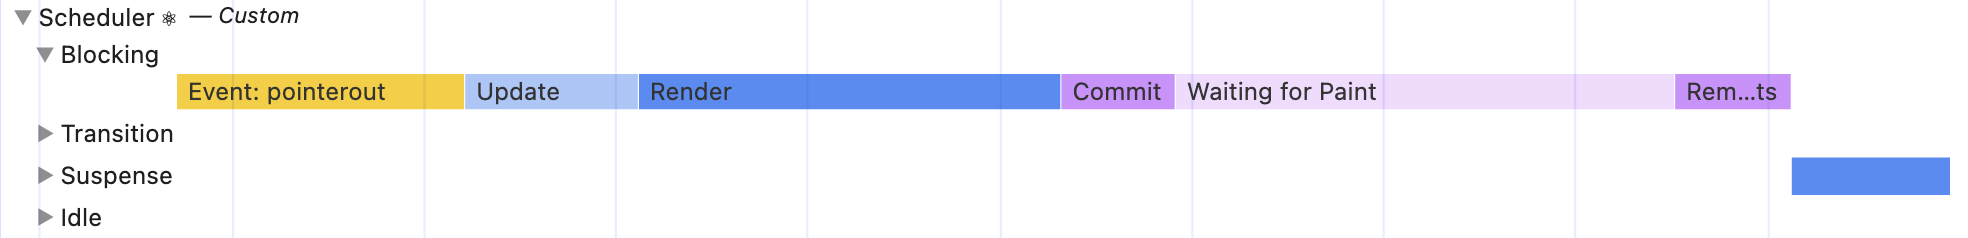
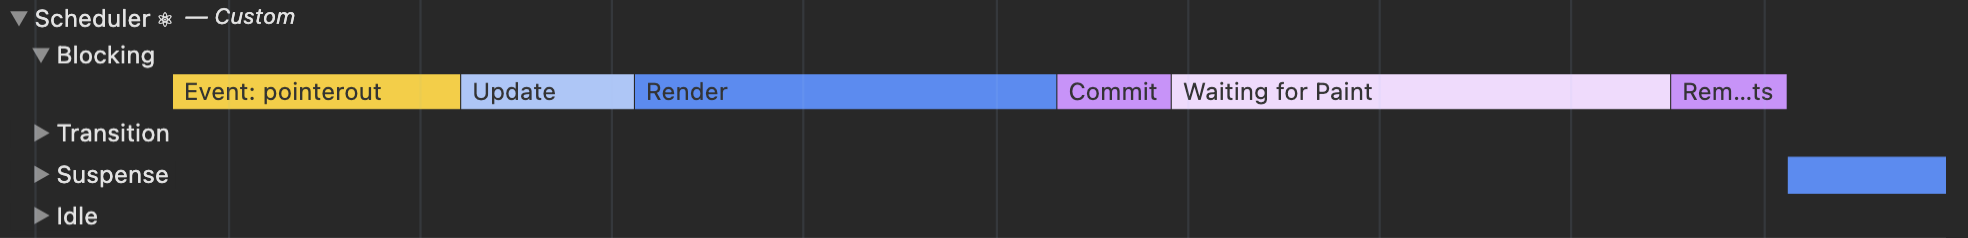
调度器是一个内部的 React 概念,用于管理具有不同优先级的任务。该轨道由 4 个子轨道组成,每个子轨道代表特定优先级的工作:
🌐 The Scheduler is an internal React concept used for managing tasks with different priorities. This track consists of 4 subtracks, each representing work of a specific priority:
- 阻塞 - 可能由用户交互触发的同步更新。
- 过渡 - 在后台进行的非阻塞工作,通常通过
startTransition发起。 - Suspense - 与 Suspense 边界相关的工作,例如显示备用内容或呈现内容。
- 空闲 - 当没有其他优先级更高的任务时进行的最低优先级工作。
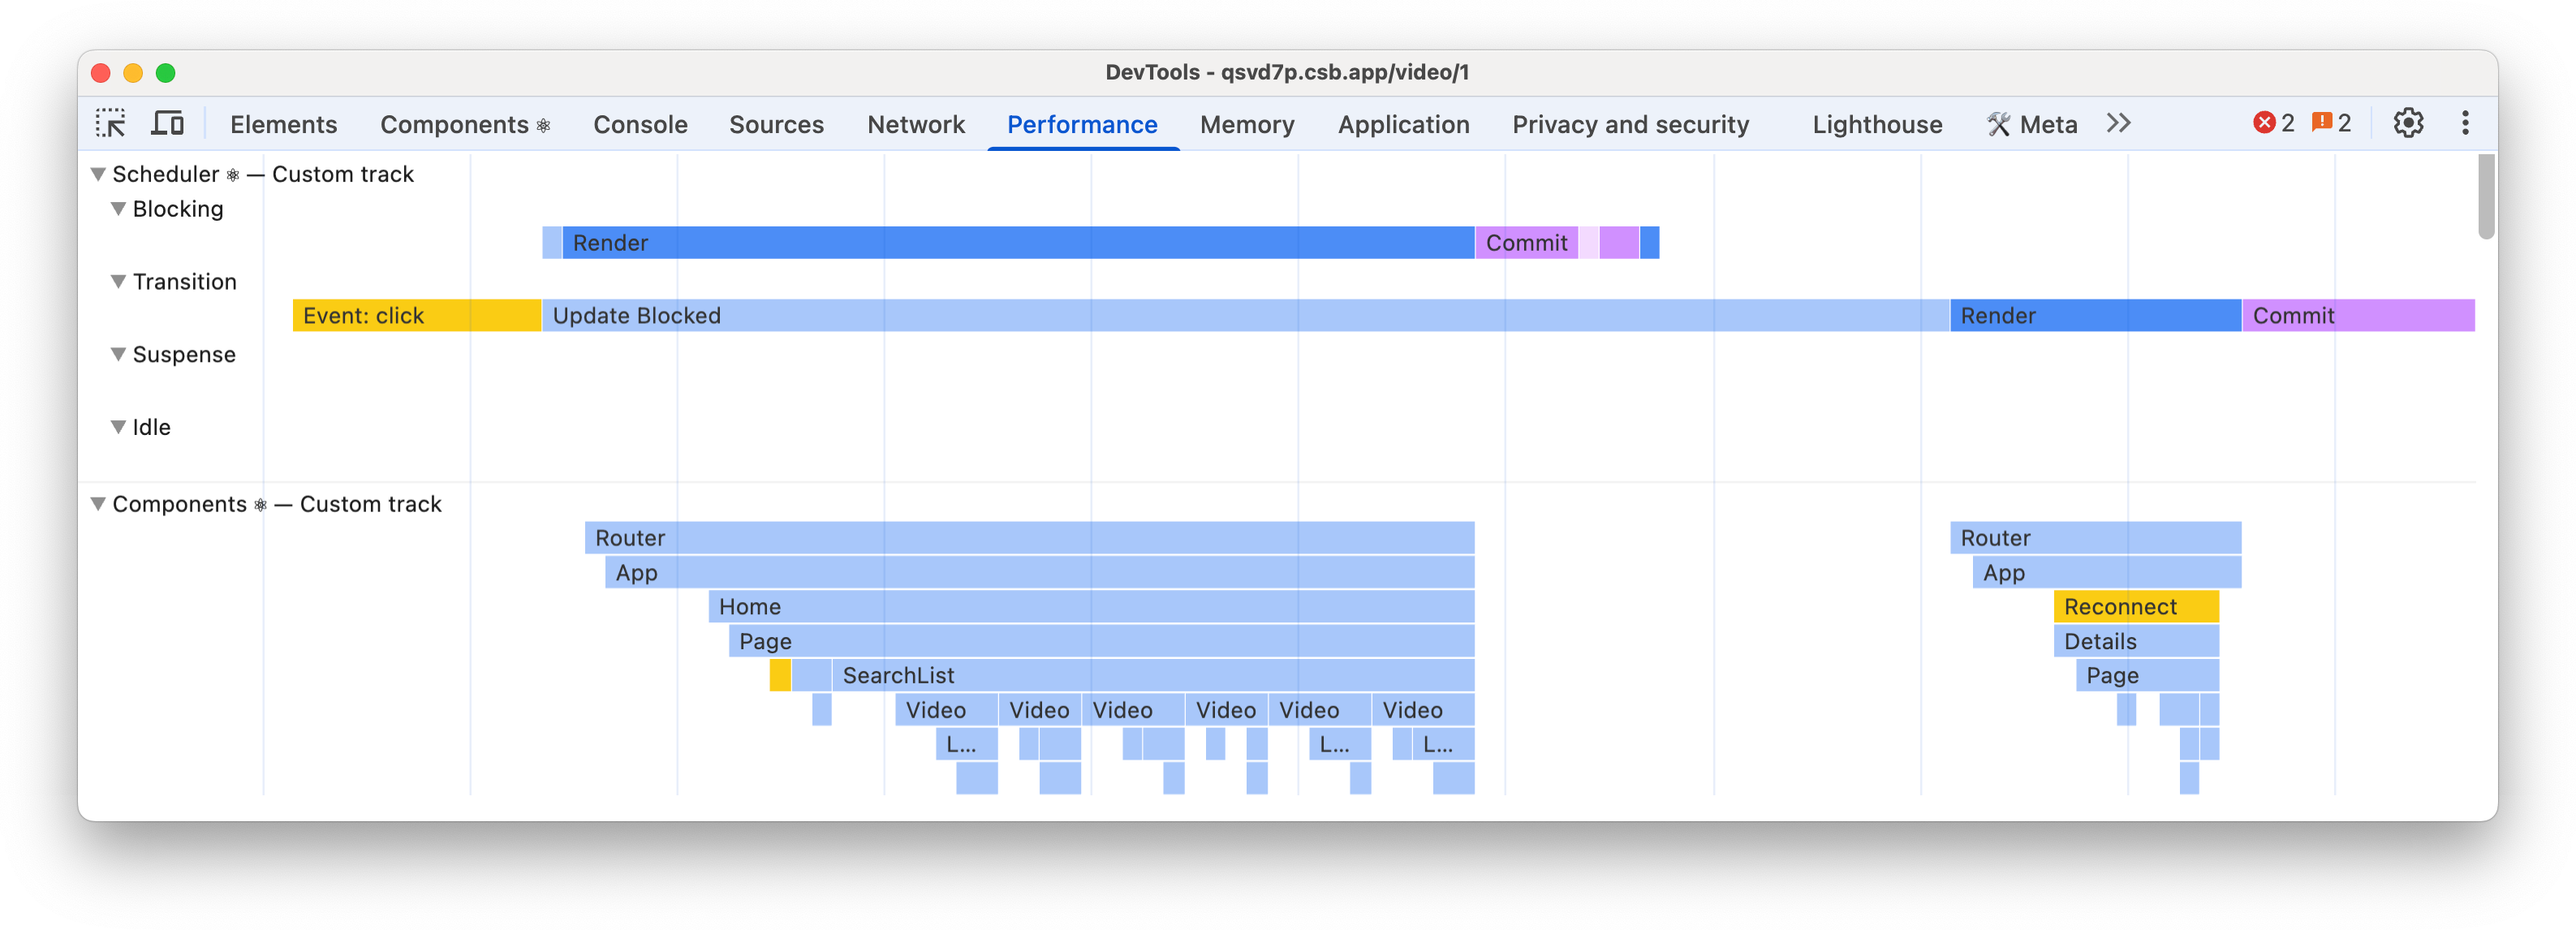
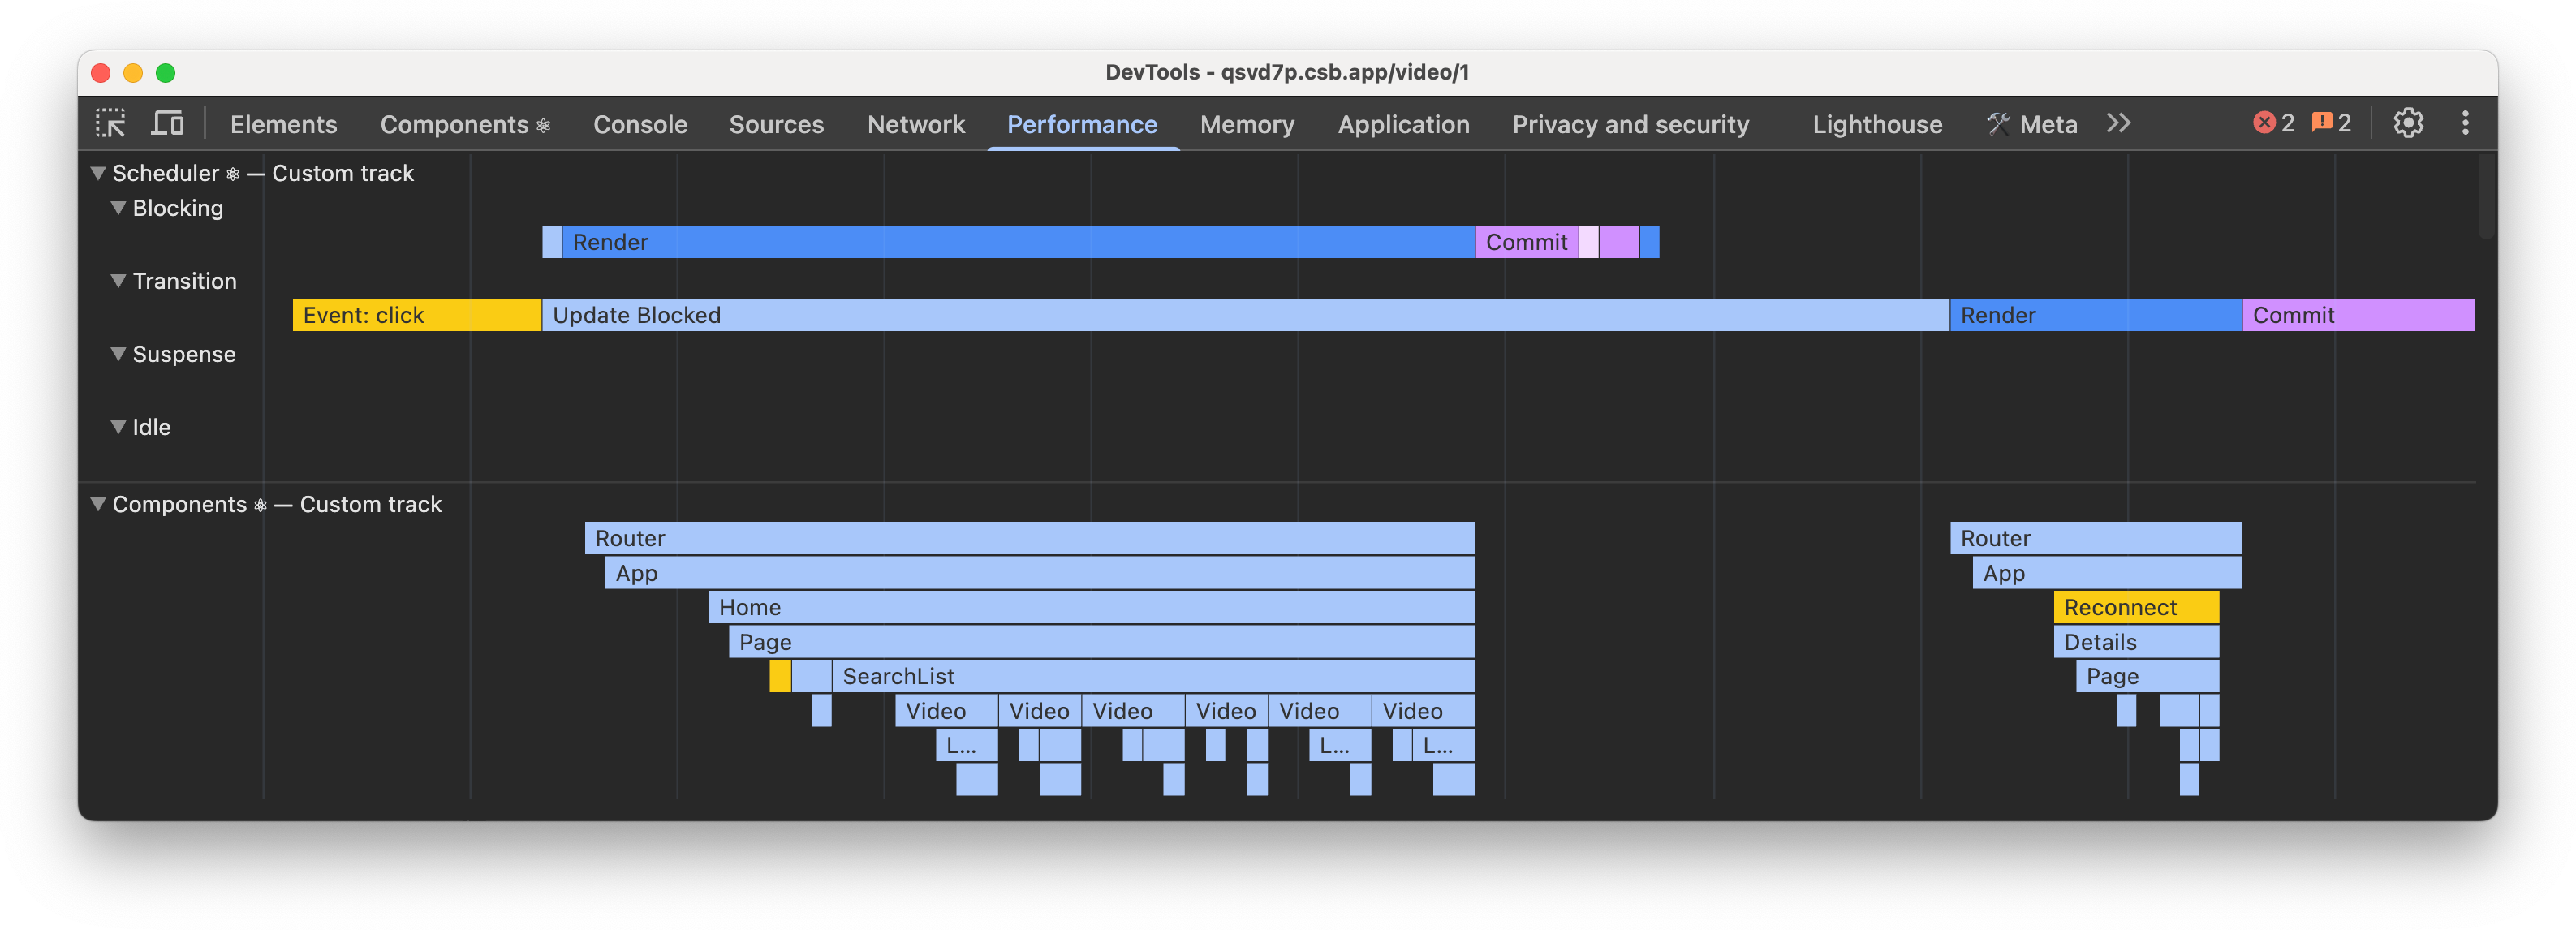
渲染
🌐 Renders
每个渲染过程都包含多个阶段,你可以在时间轴上看到这些阶段:
🌐 Every render pass consists of multiple phases that you can see on a timeline:
- 更新 - 这是导致新渲染过程的原因。
- 渲染 - React 通过调用组件的渲染函数来渲染更新后的子树。你可以在 组件跟踪 上看到渲染后的组件子树,该跟踪遵循相同的配色方案。
- 提交 - 在渲染组件之后,React 会将更改提交到 DOM 并运行布局副作用,例如
useLayoutEffect。 - 剩余效果 - React 执行已渲染子树的被动效果。这通常发生在绘制之后,此时 React 会运行像
useEffect这样的钩子。一个已知的例外是用户交互,比如点击或其他离散事件。在这种情况下,这个阶段可能会在绘制之前运行。
级联更新
🌐 Cascading updates
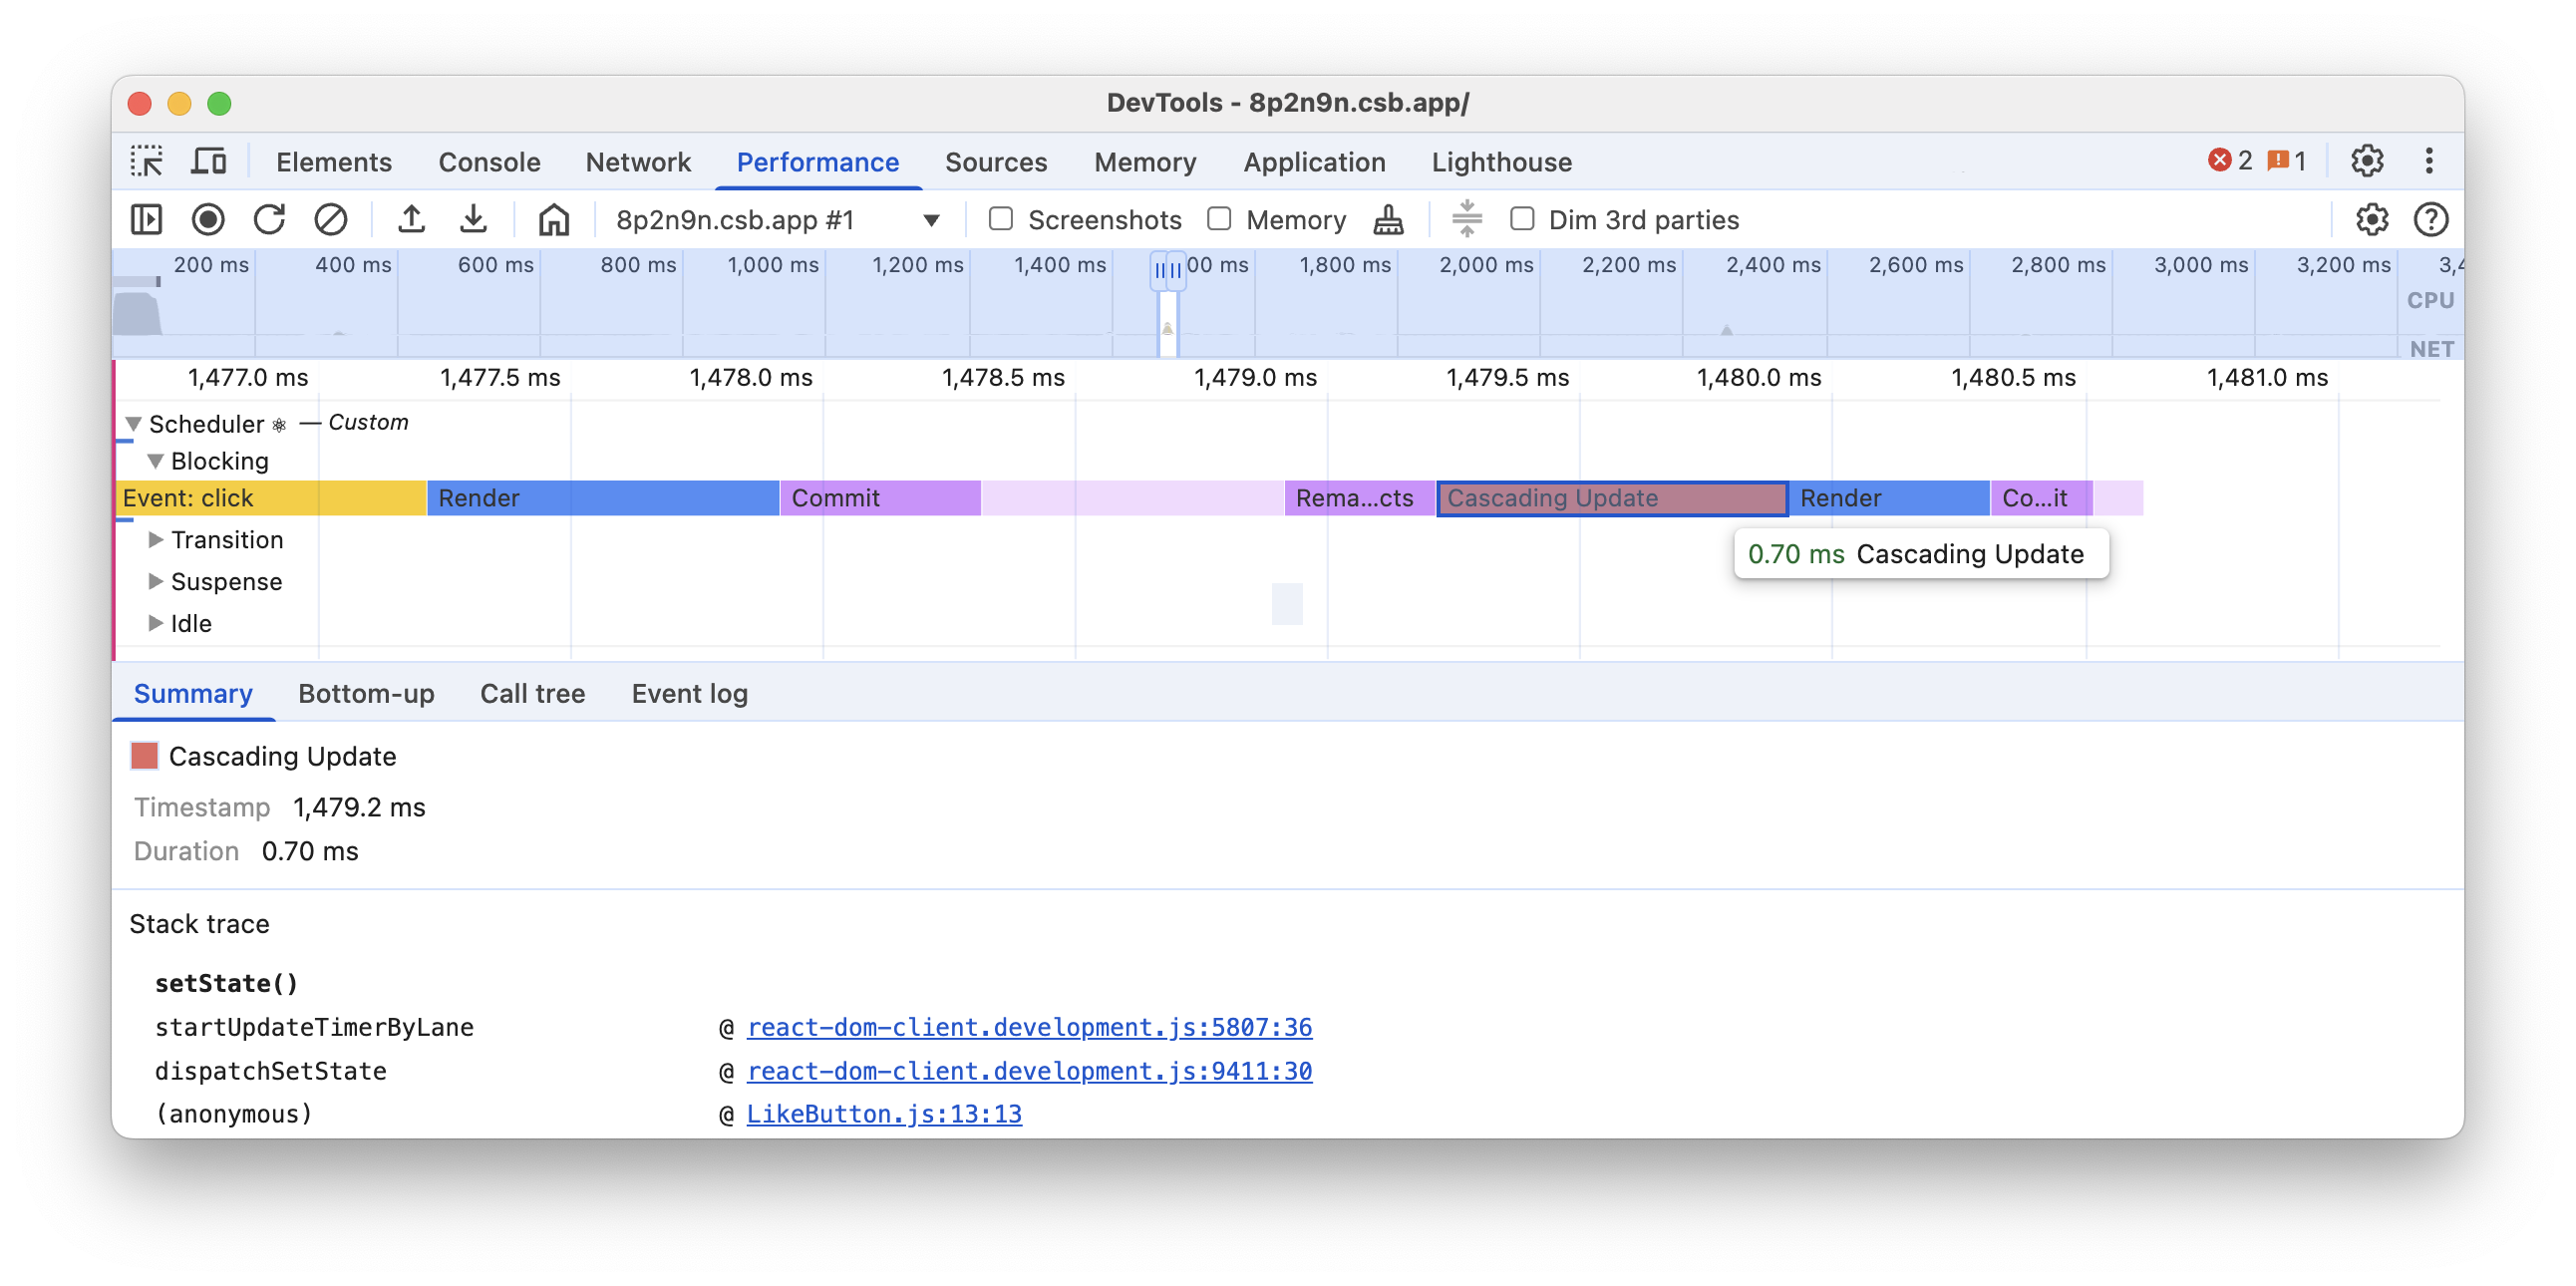
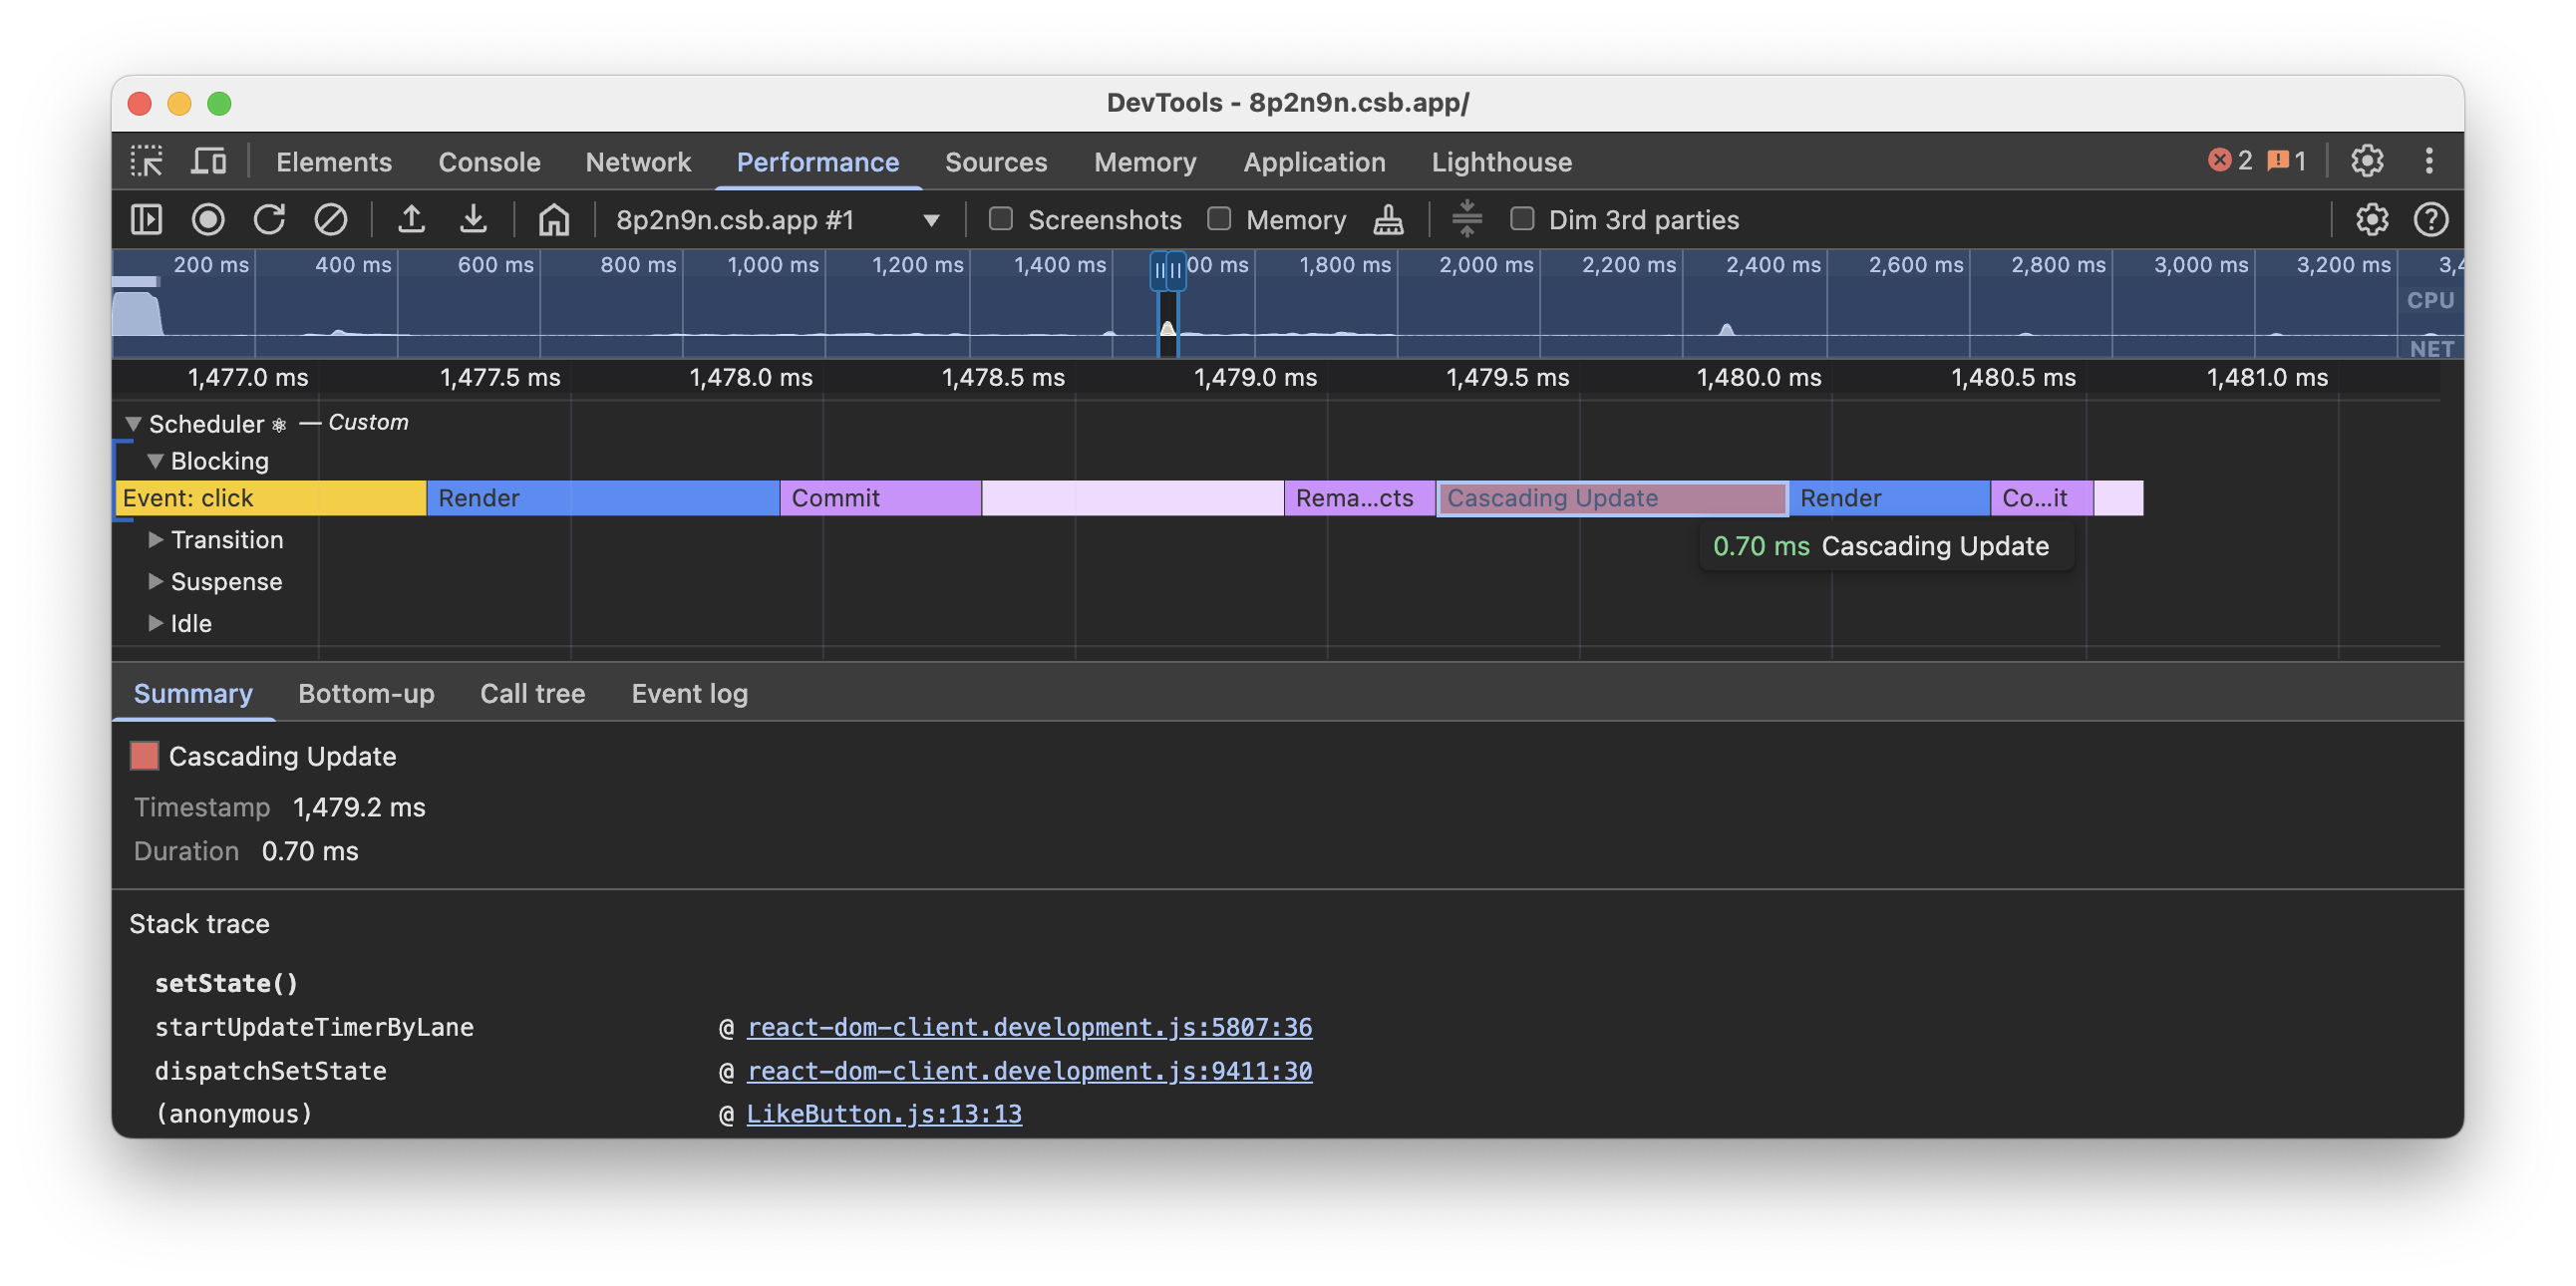
级联更新是性能回退的模式之一。如果在渲染过程中安排了更新,React 可能会丢弃已完成的工作并开始新的渲染过程。
🌐 Cascading updates is one of the patterns for performance regressions. If an update was scheduled during a render pass, React could discard completed work and start a new pass.
在开发构建中,React 可以向你显示哪个组件安排了新的更新。这包括一般更新和级联更新。你可以通过点击“级联更新”条目来查看增强的堆栈跟踪,该条目还应该显示安排更新的方法名称。
🌐 In development builds, React can show you which Component scheduled a new update. This includes both general updates and cascading ones. You can see the enhanced stack trace by clicking on the “Cascading update” entry, which should also display the name of the method that scheduled an update.
组件
🌐 Components
组件轨迹可视化React组件的持续时间。它们以火焰图的形式显示,每个条目表示相应组件渲染及其所有子孙组件的持续时间。
🌐 The Components track visualizes the durations of React components. They are displayed as a flamegraph, where each entry represents the duration of the corresponding component render and all its descendant children components.
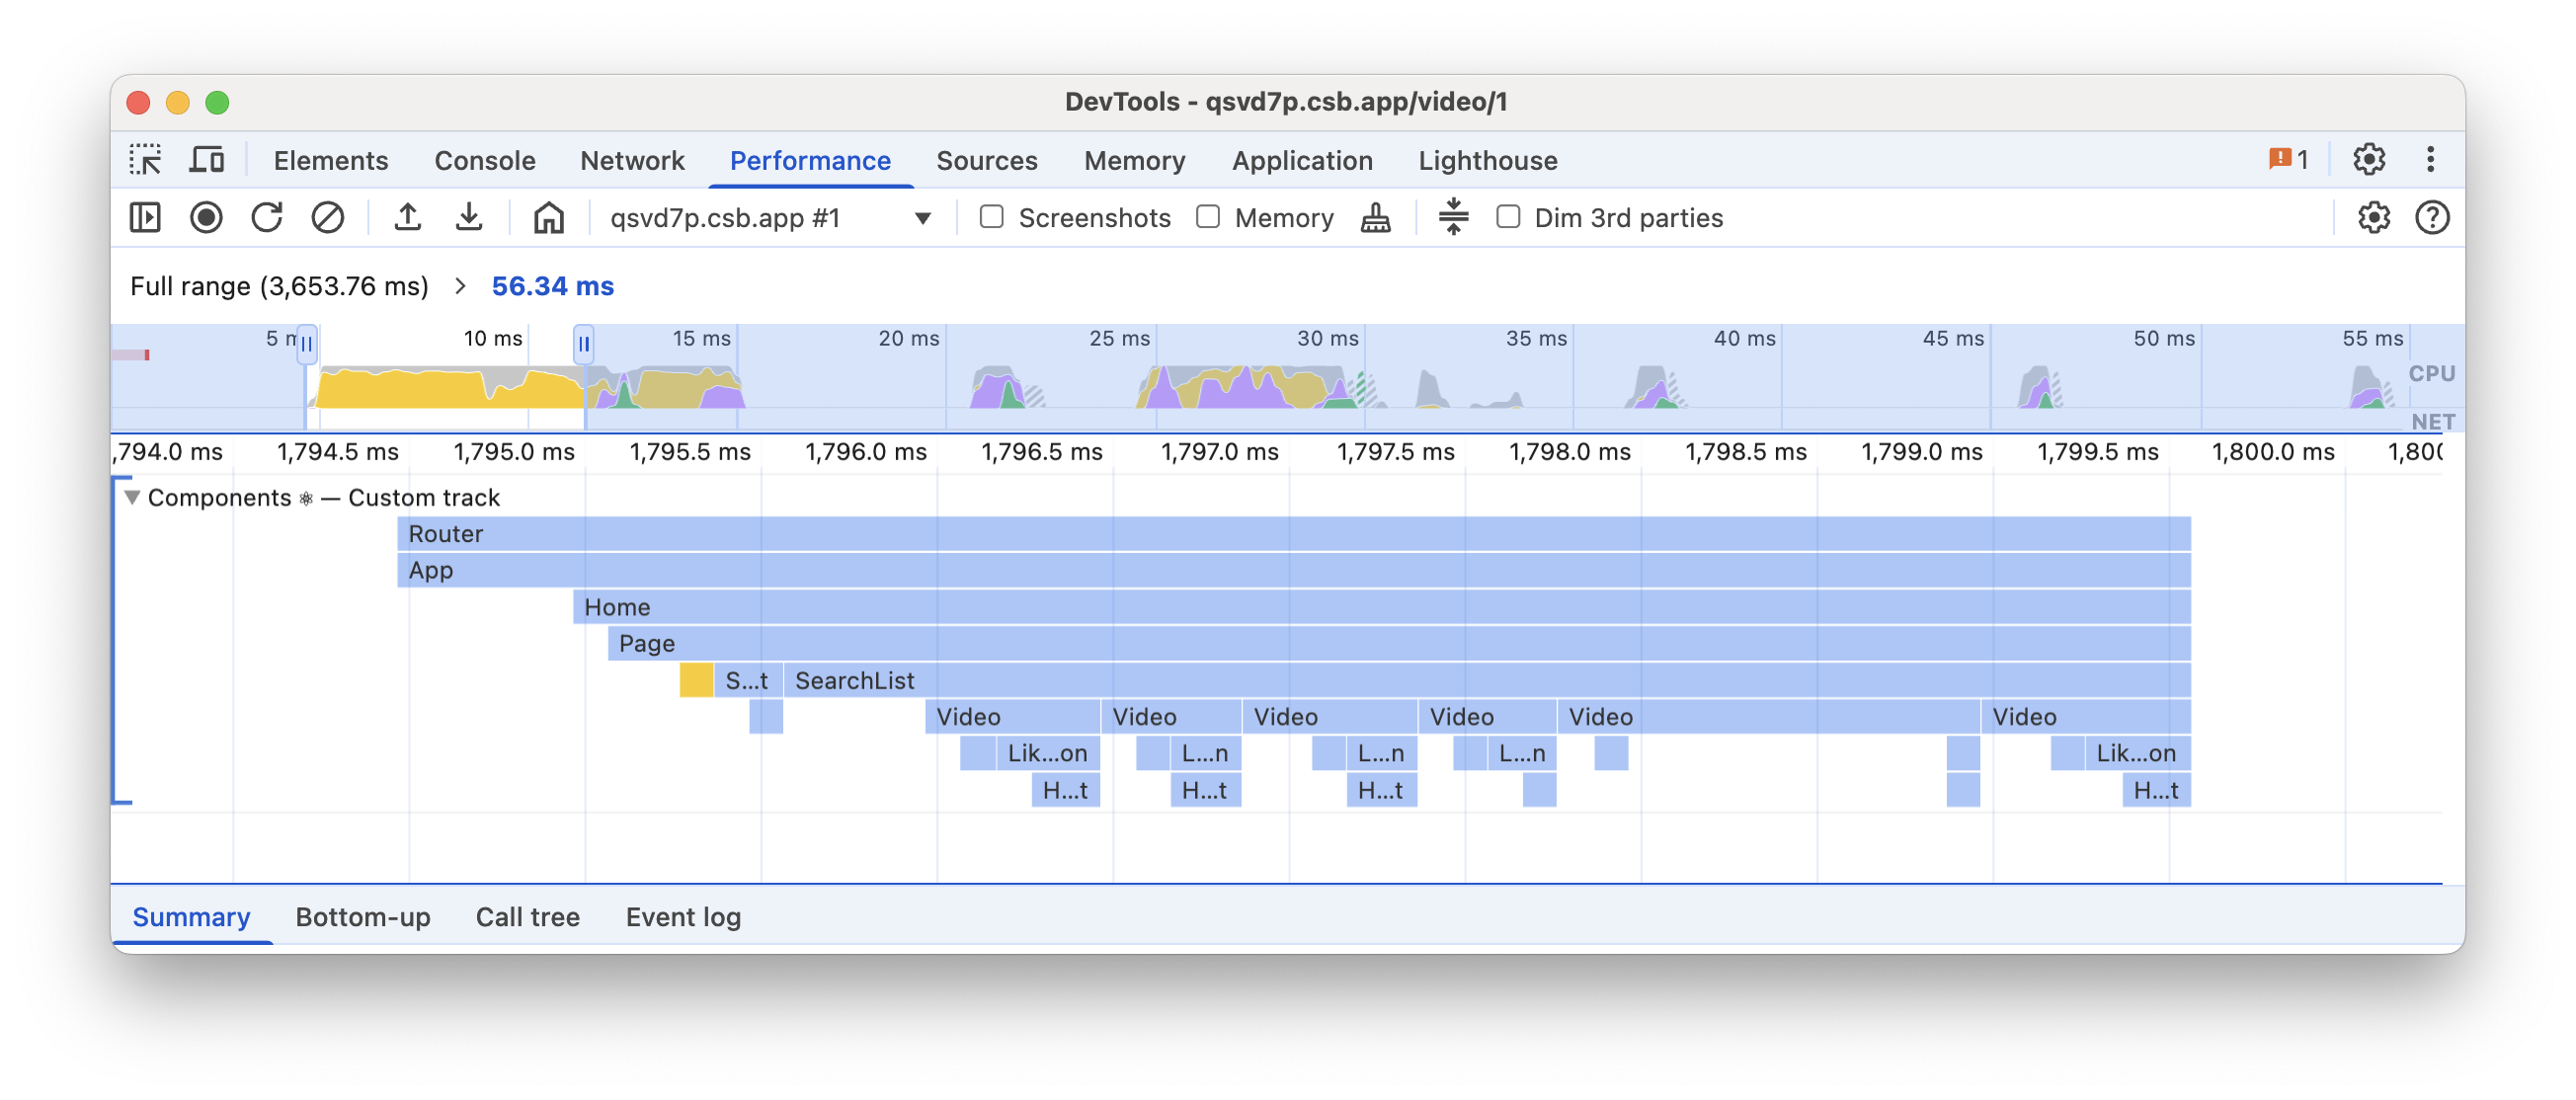
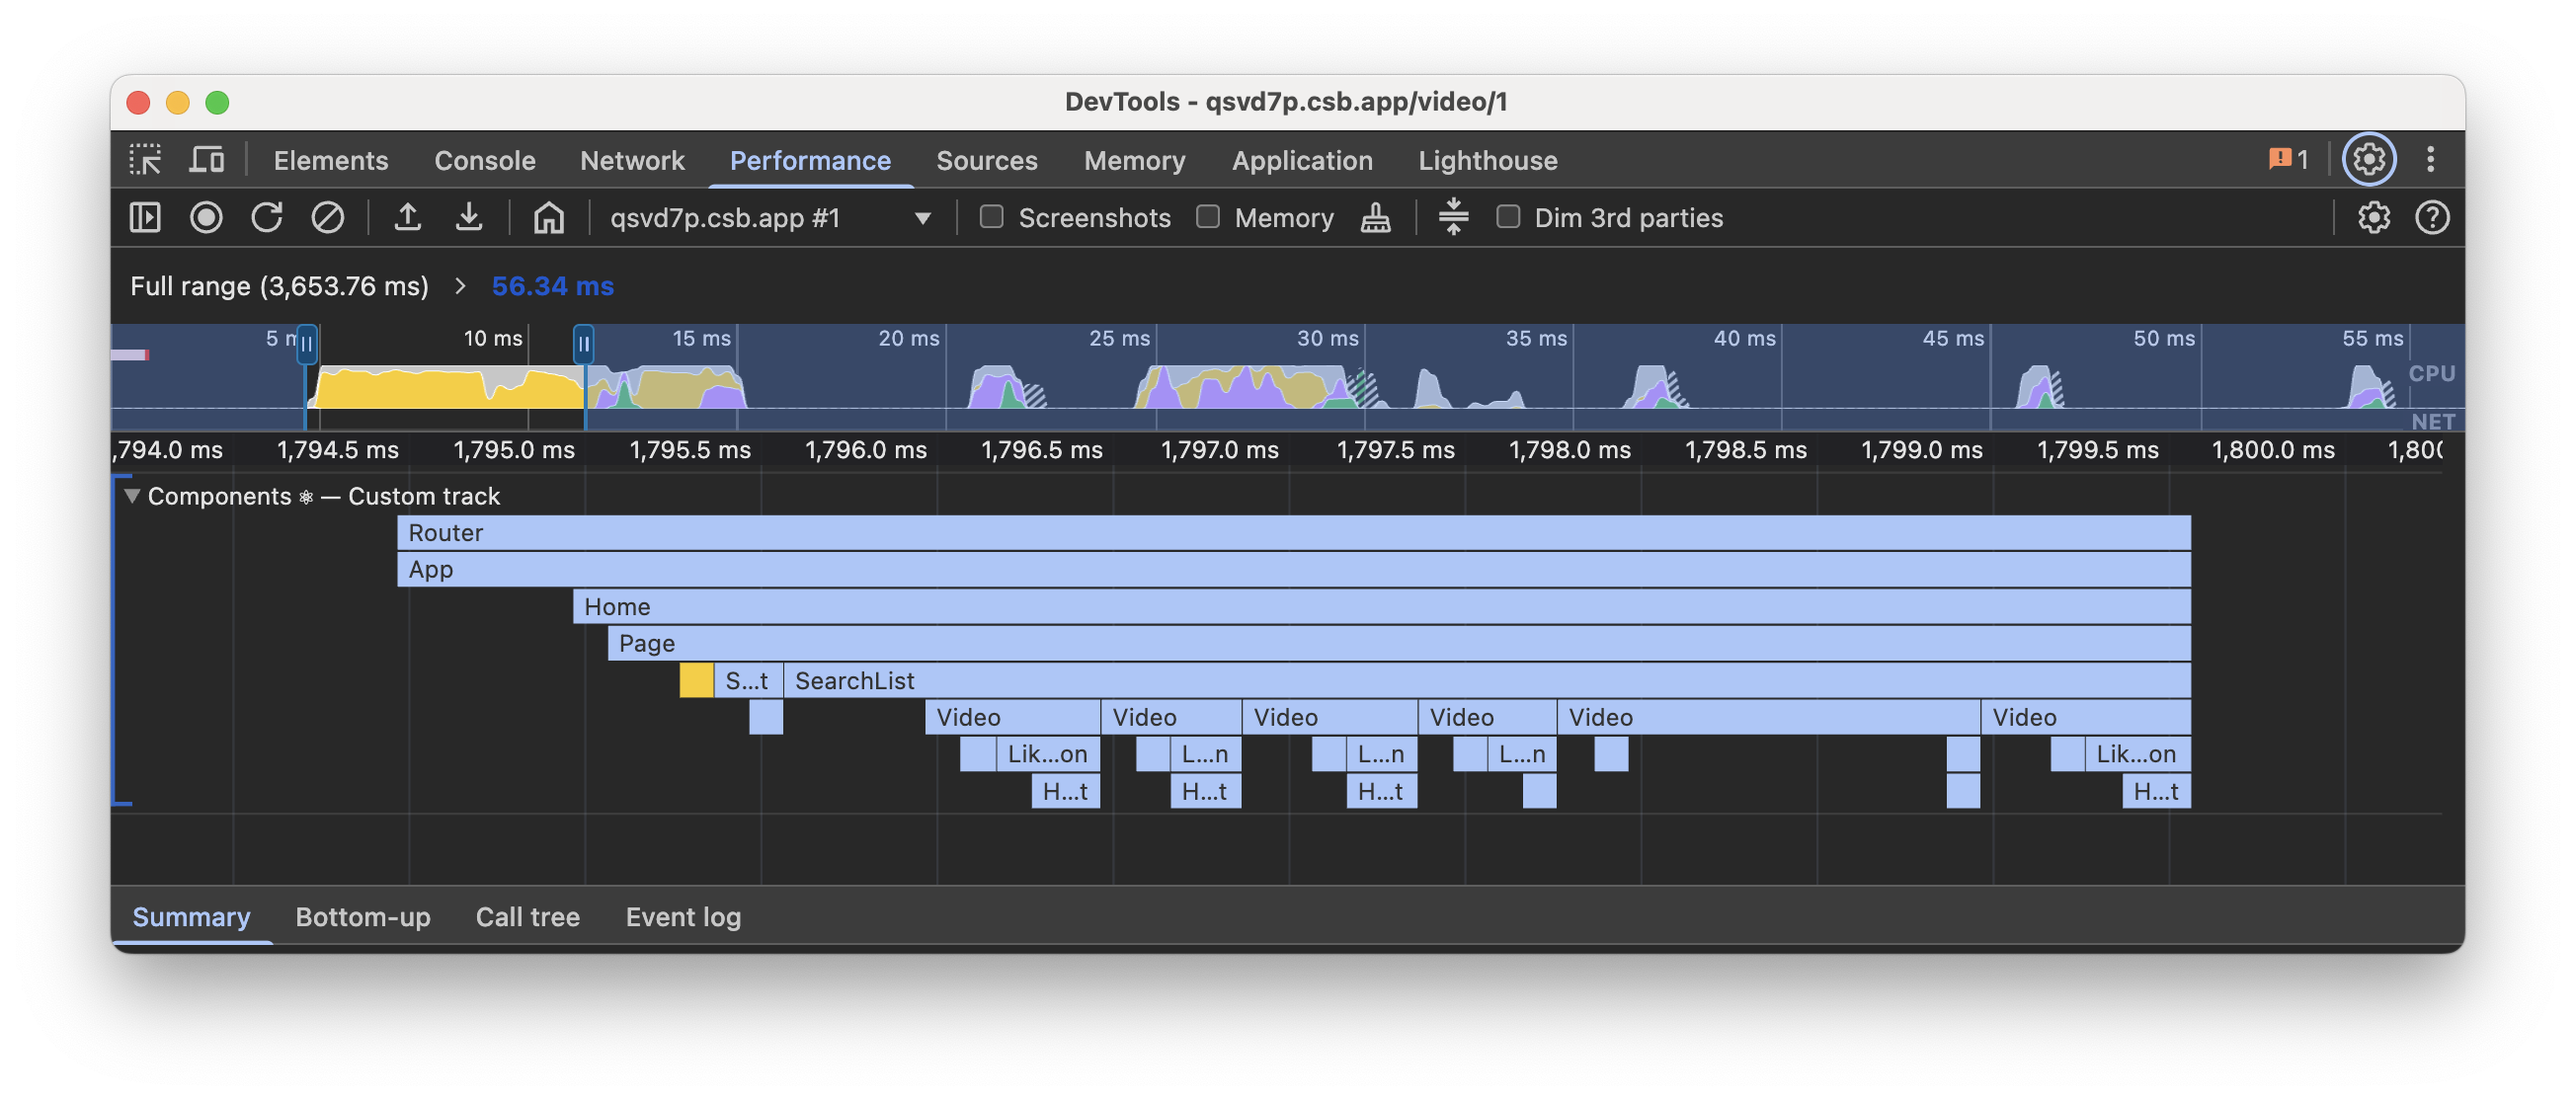
与渲染时长类似,effect 时长也以火焰图的形式表示,但颜色方案不同,与 Scheduler 轨道上的相应阶段保持一致。
🌐 Similar to render durations, effect durations are also represented as a flamegraph, but with a different color scheme that aligns with the corresponding phase on the Scheduler track.
在渲染和效果阶段可能会显示其他事件:
🌐 Additional events may be displayed during the render and effects phases:
- 挂载 - 组件渲染或效果的对应子树已被挂载。
- 卸载 - 组件渲染或副作用的对应子树已被卸载。
- 重新连接 - 类似于挂载,但仅限于使用
<Activity>的情况。 - 断开连接 - 类似于卸载,但仅限于使用
<Activity>的情况。
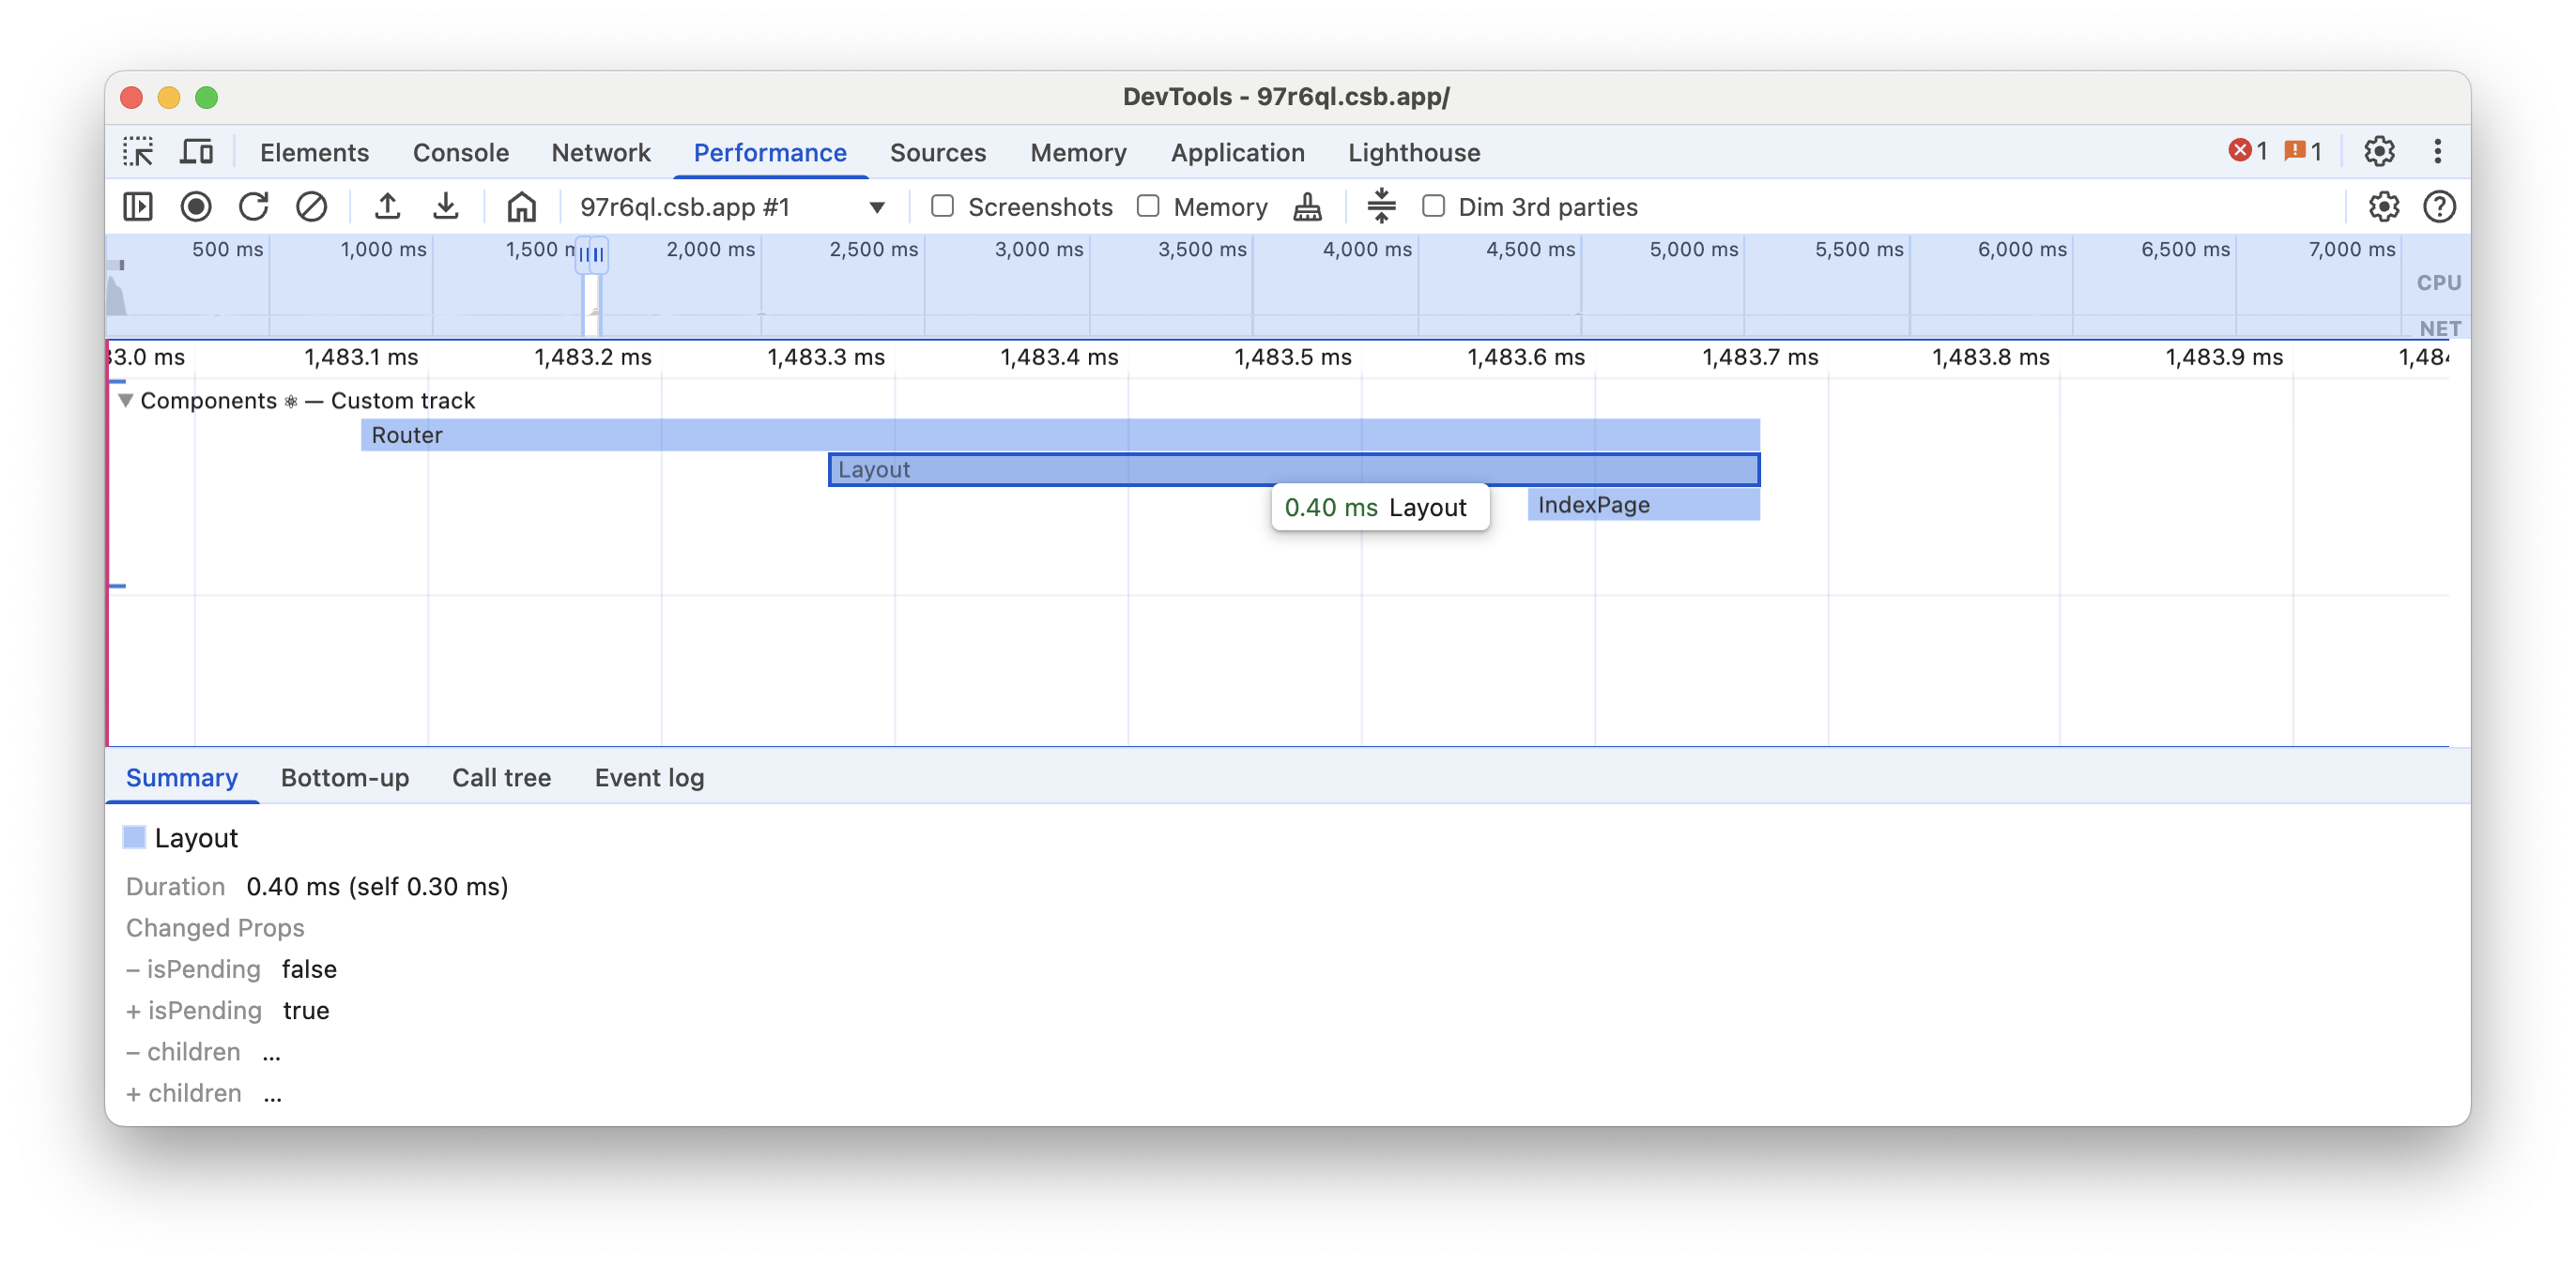
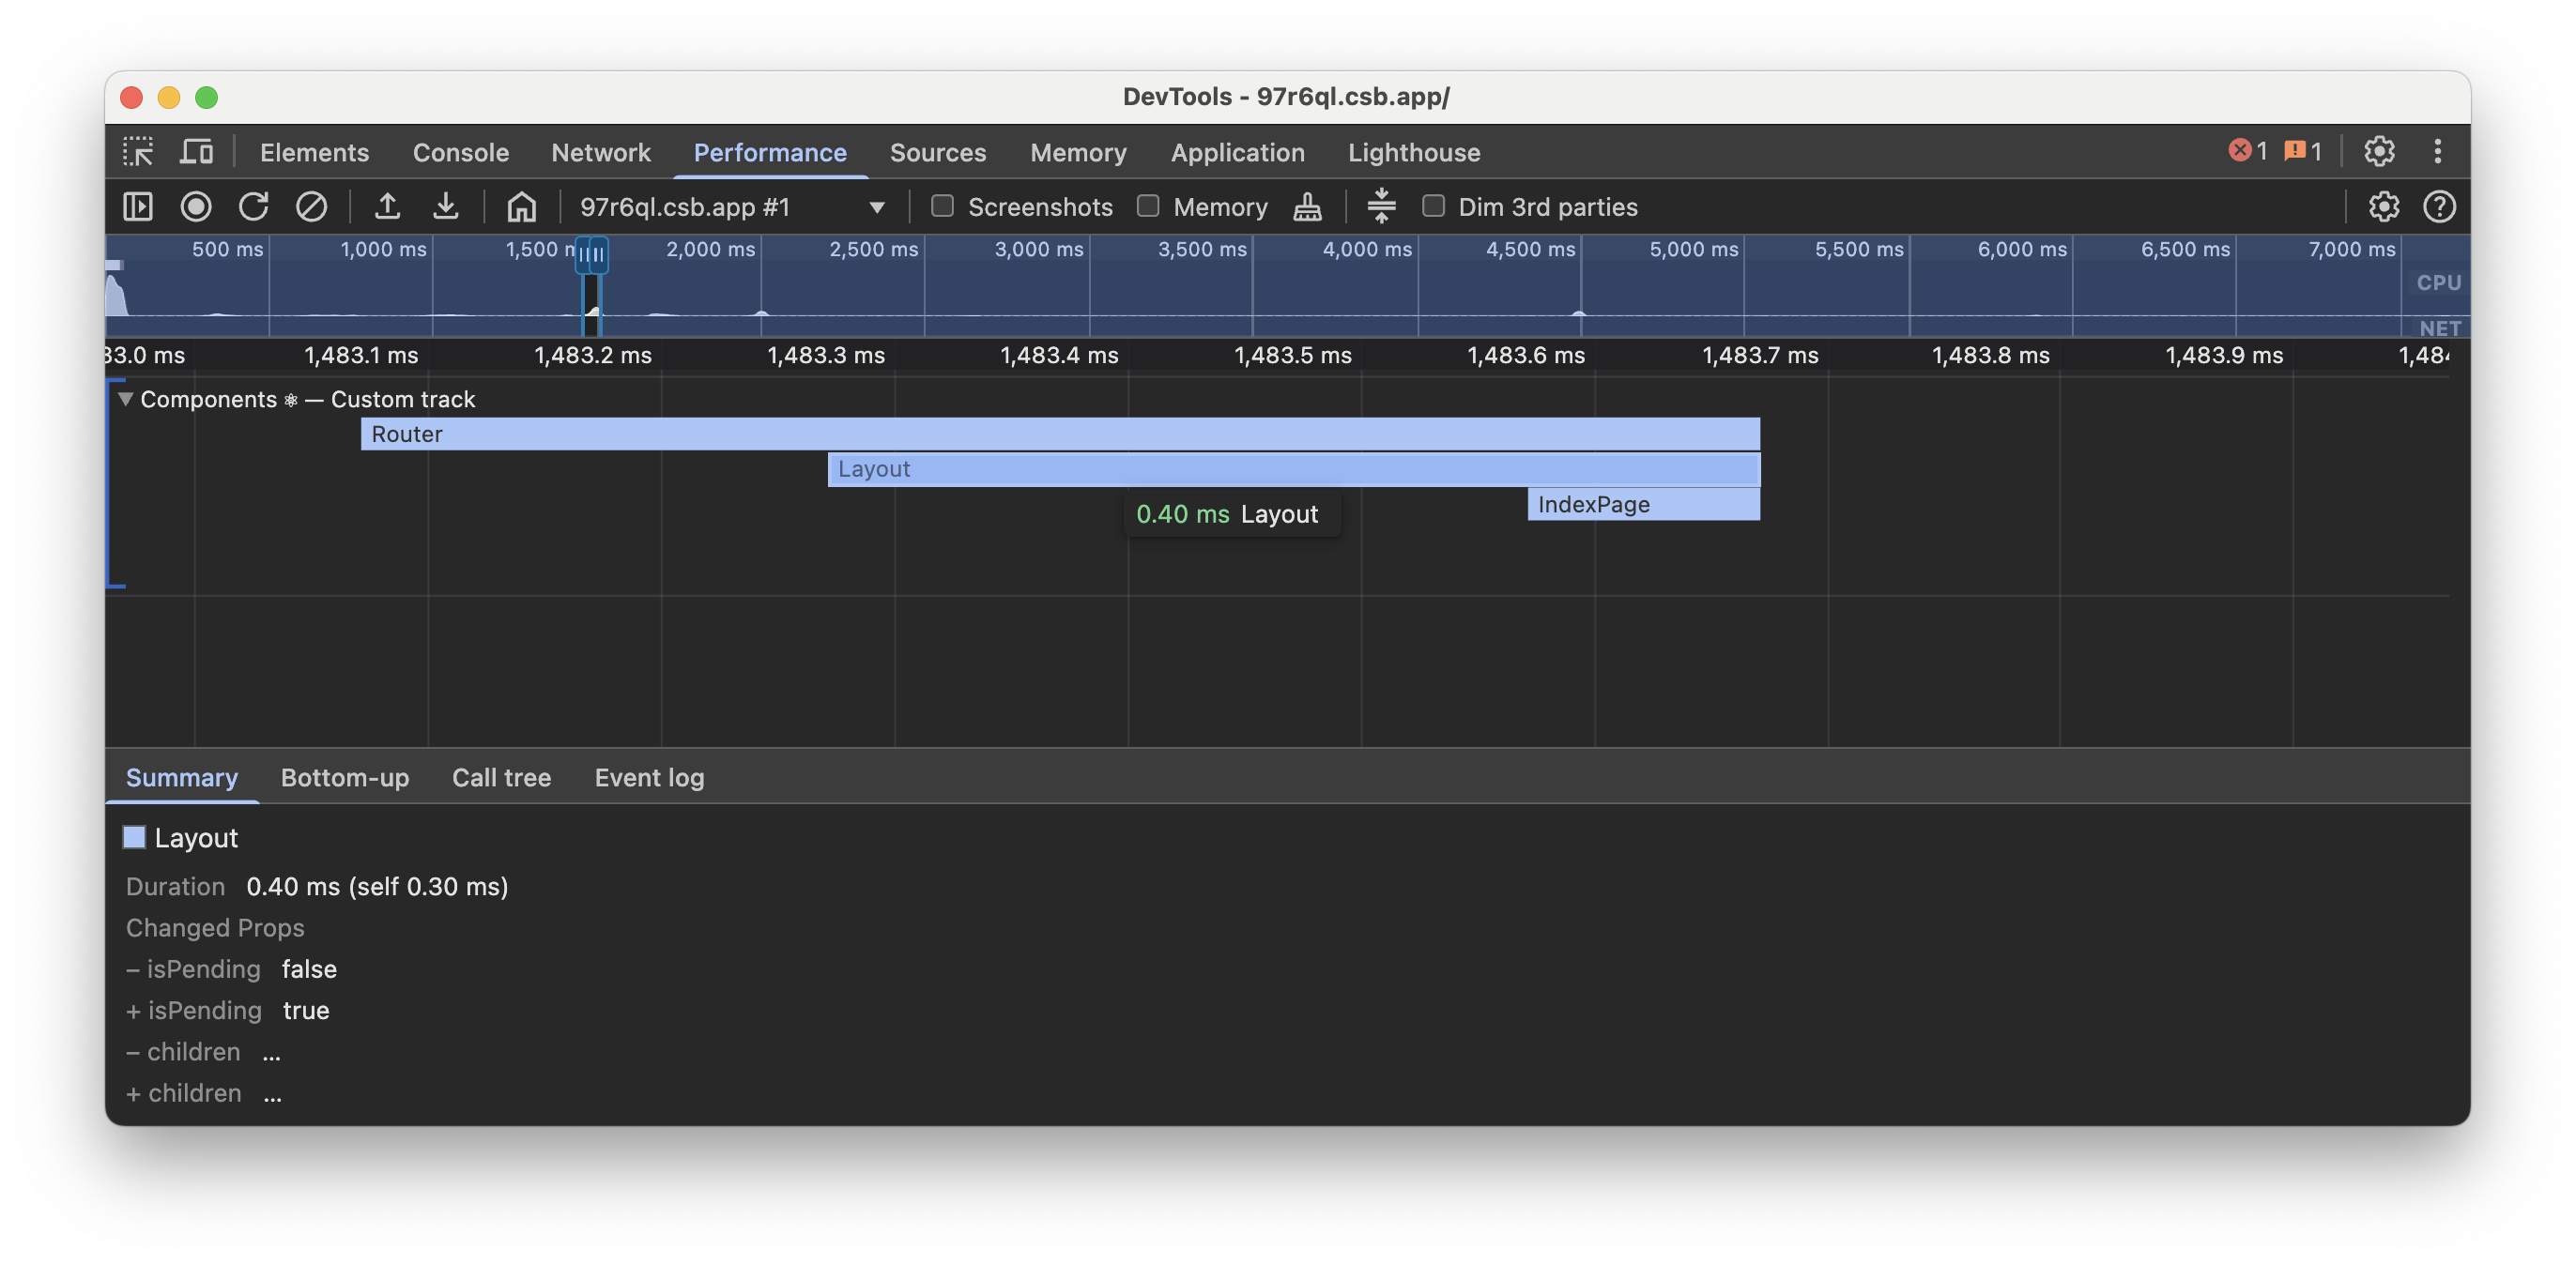
更改的属性
🌐 Changed props
在开发版本中,当你点击组件渲染条目时,你可以检查 props 中的潜在变化。你可以使用这些信息来识别不必要的渲染。
🌐 In development builds, when you click on a component render entry, you can inspect potential changes in props. You can use this information to identify unnecessary renders.
服务器
🌐 Server
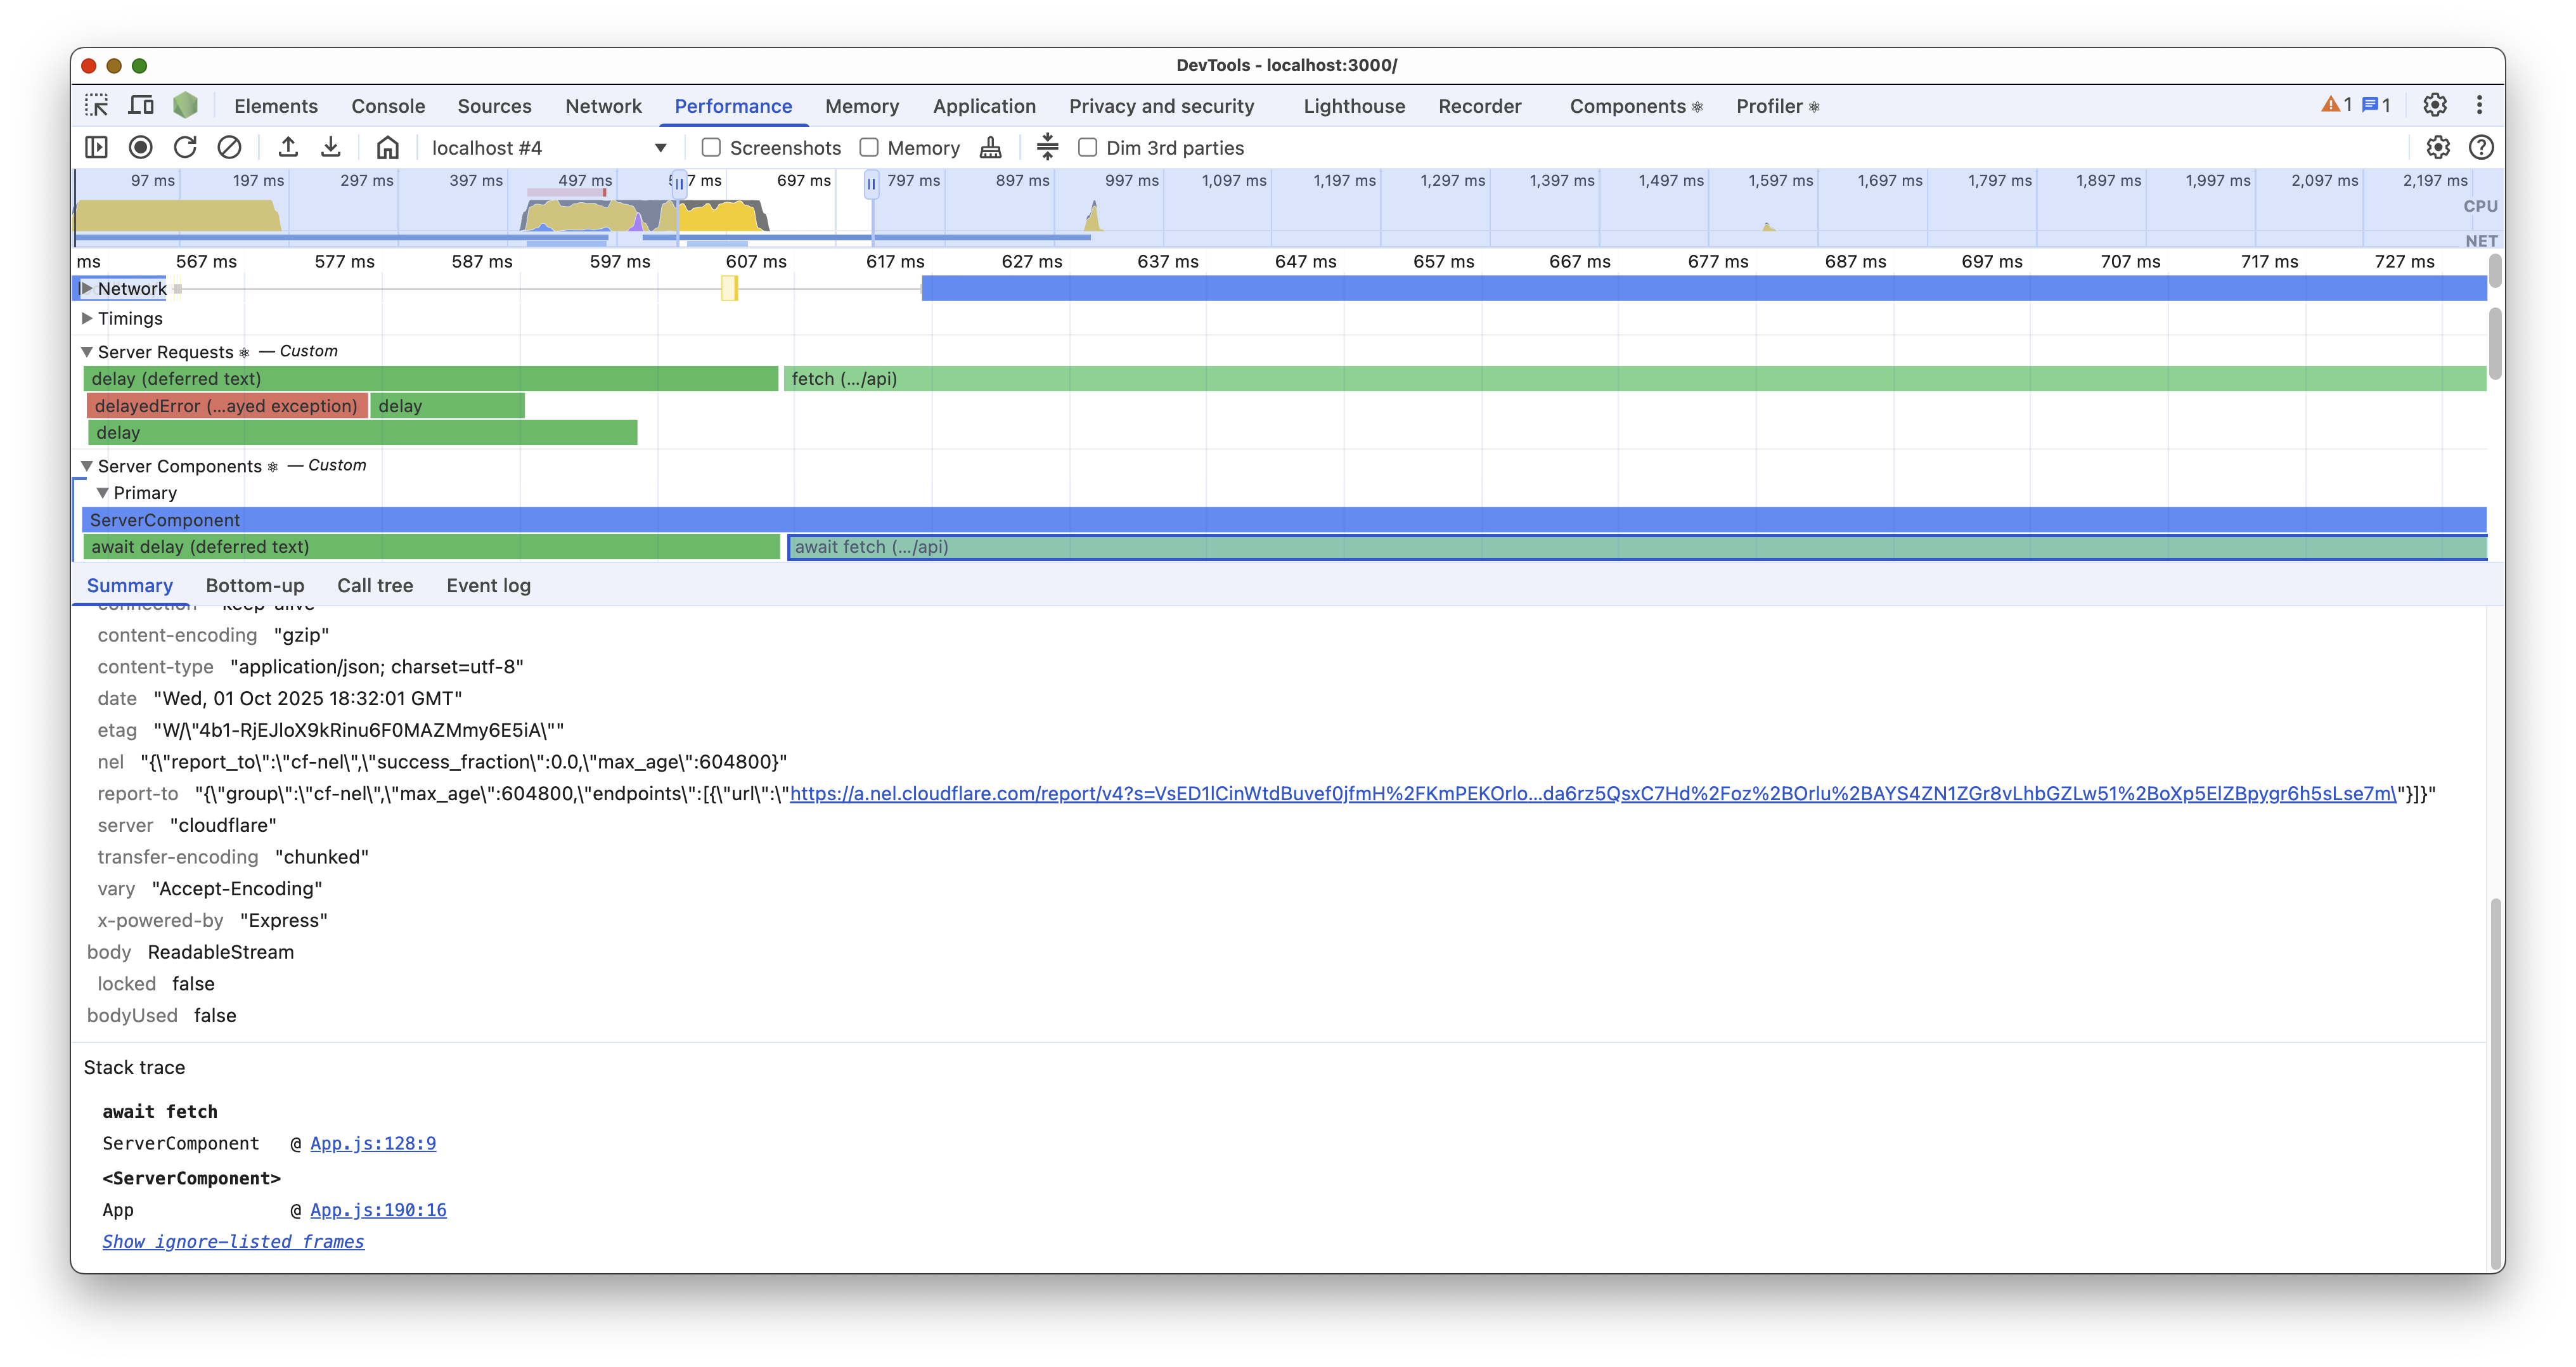
服务器请求
🌐 Server Requests
服务器请求跟踪可视化了最终进入 React 服务器组件的所有 Promise。这包括任何 async 操作,例如调用 fetch 或异步 Node.js 文件操作。
🌐 The Server Requests track visualized all Promises that eventually end up in a React Server Component. This includes any async operations like calling fetch or async Node.js file operations.
React 将尝试将从第三方代码内部启动的 Promise 合并为一个单独的跨度,表示整个操作阻塞第一方代码的持续时间。例如,一个名为 getUser 的第三方库方法,如果内部多次调用 fetch,将被表示为一个名为 getUser 的单一跨度,而不是显示多个 fetch 跨度。
🌐 React will try to combine Promises that are started from inside third-party code into a single span representing the the duration of the entire operation blocking 1st party code.
For example, a third party library method called getUser that calls fetch internally multiple times will be represented as a single span called getUser, instead of showing multiple fetch spans.
点击 span 将显示 Promise 创建位置的堆栈跟踪,以及 Promise 解析为的值的视图(如果有)。
🌐 Clicking on spans will show you a stack trace of where the Promise was created as well as a view of the value that the Promise resolved to, if available.
被拒绝的 Promise 会显示为红色,并带有其被拒绝的值。
🌐 Rejected Promises are displayed as red with their rejected value.
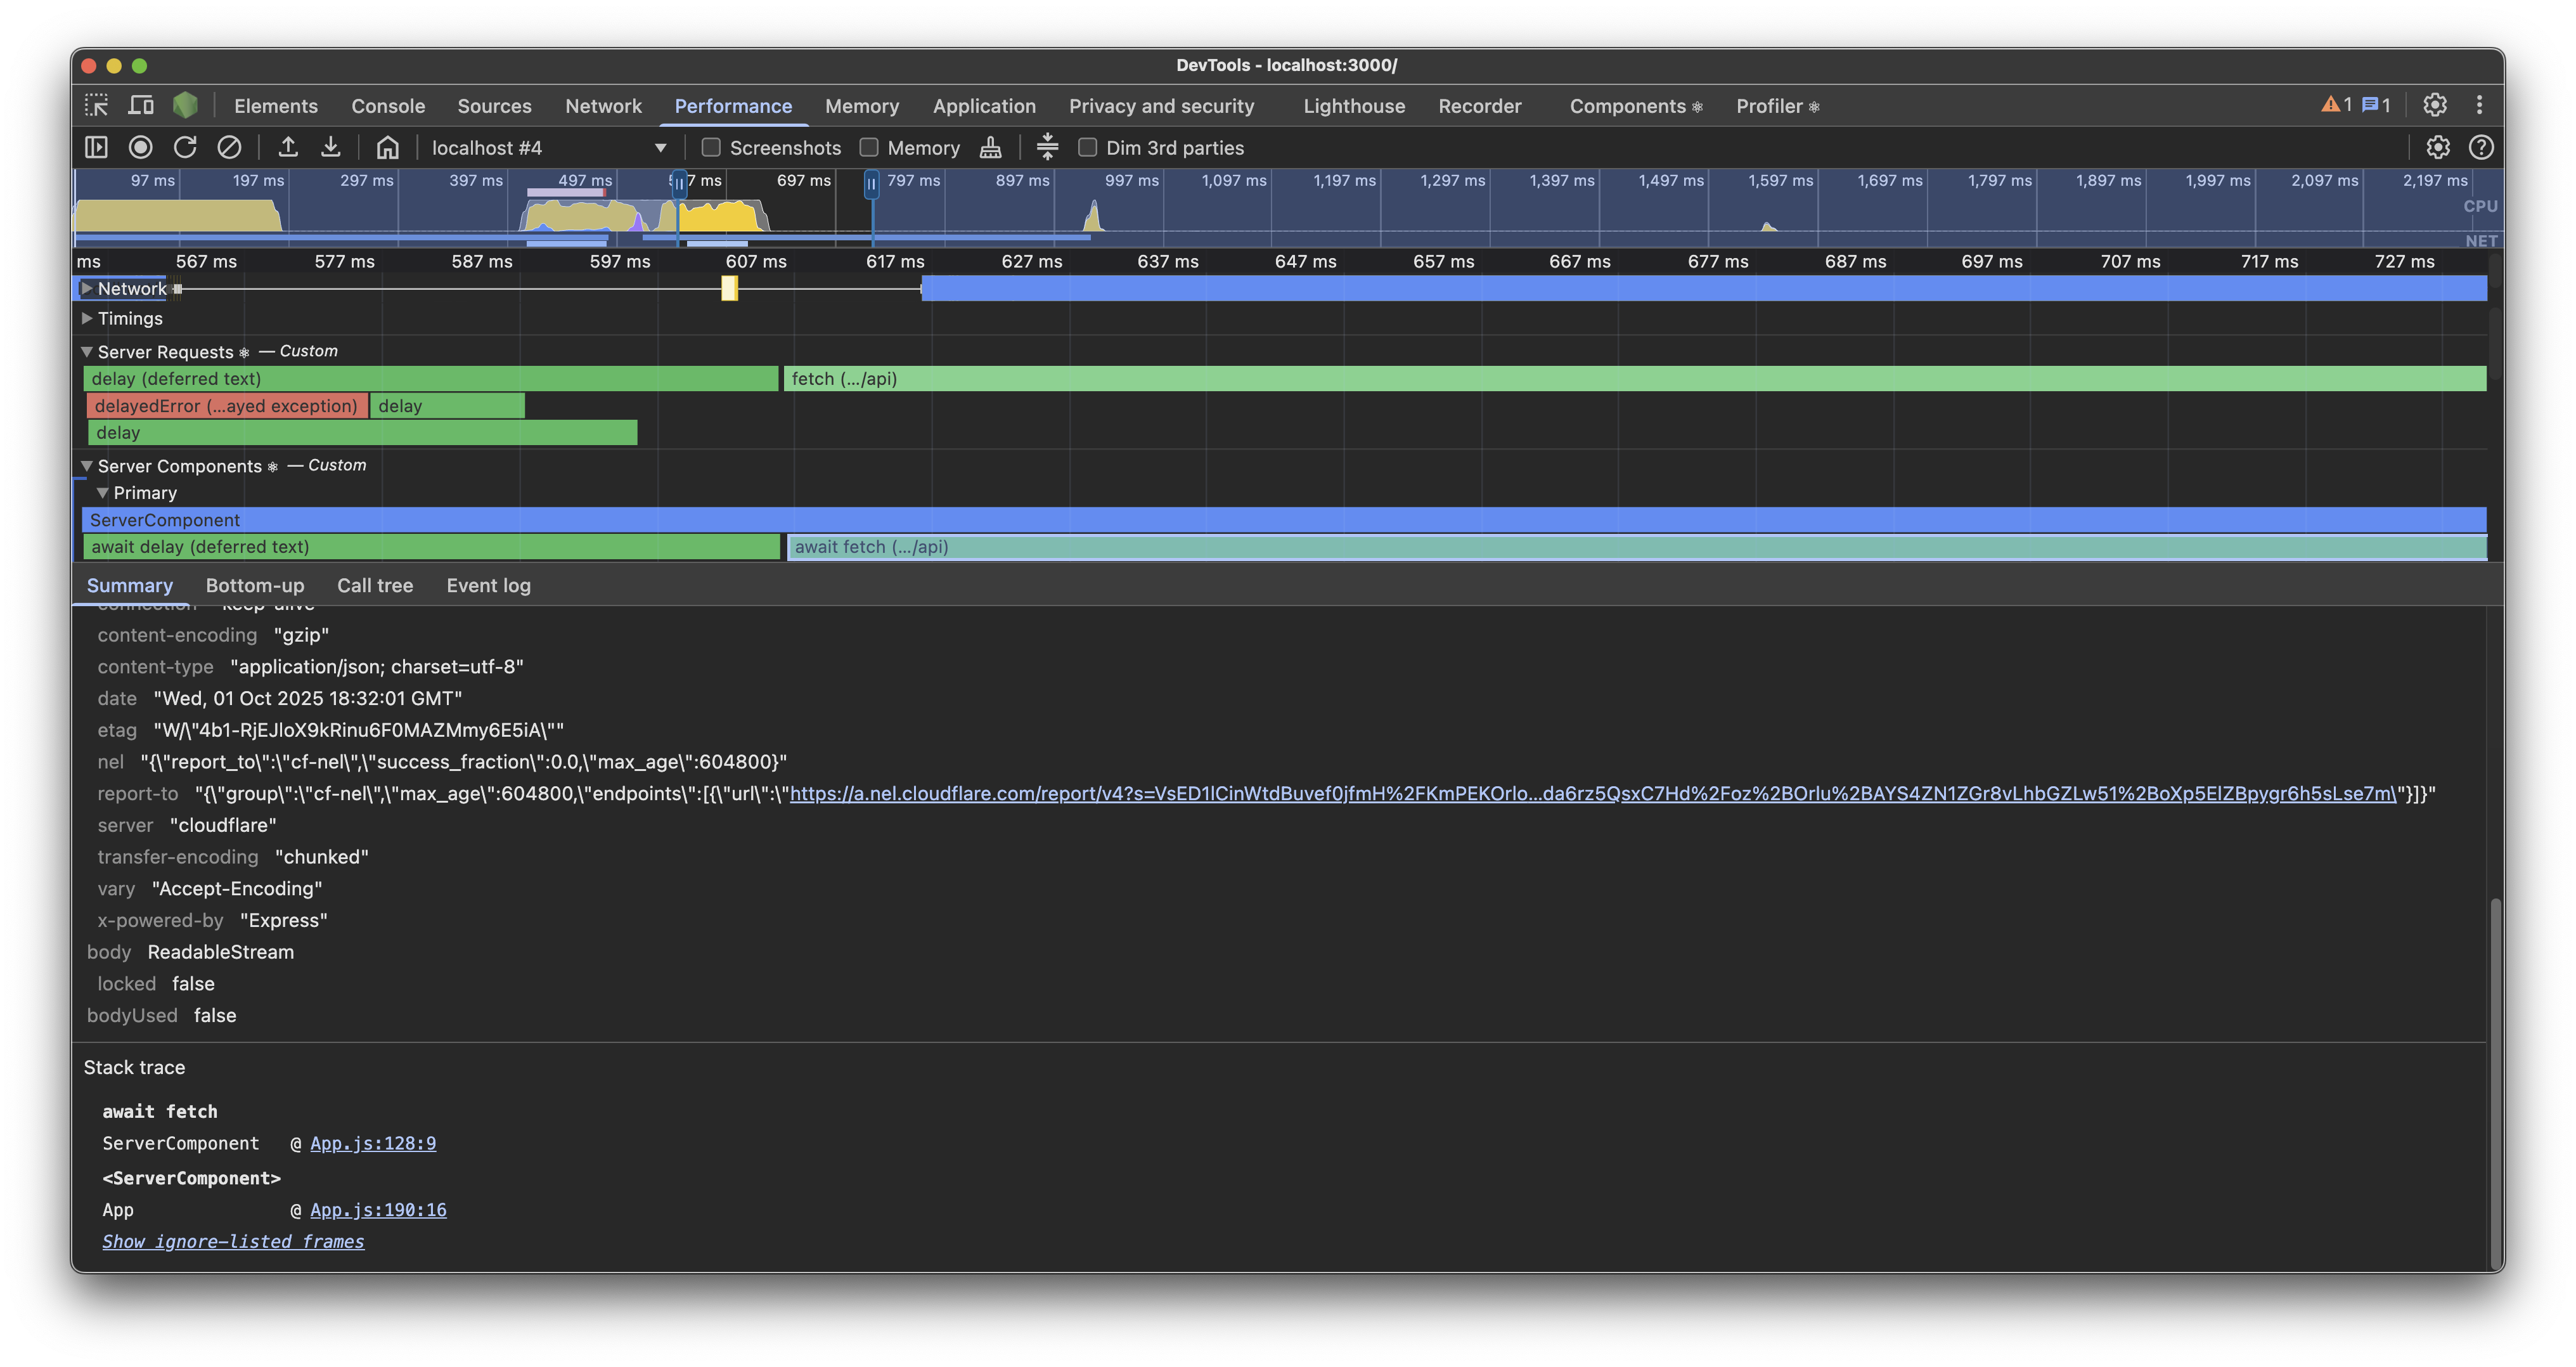
服务器组件
🌐 Server Components
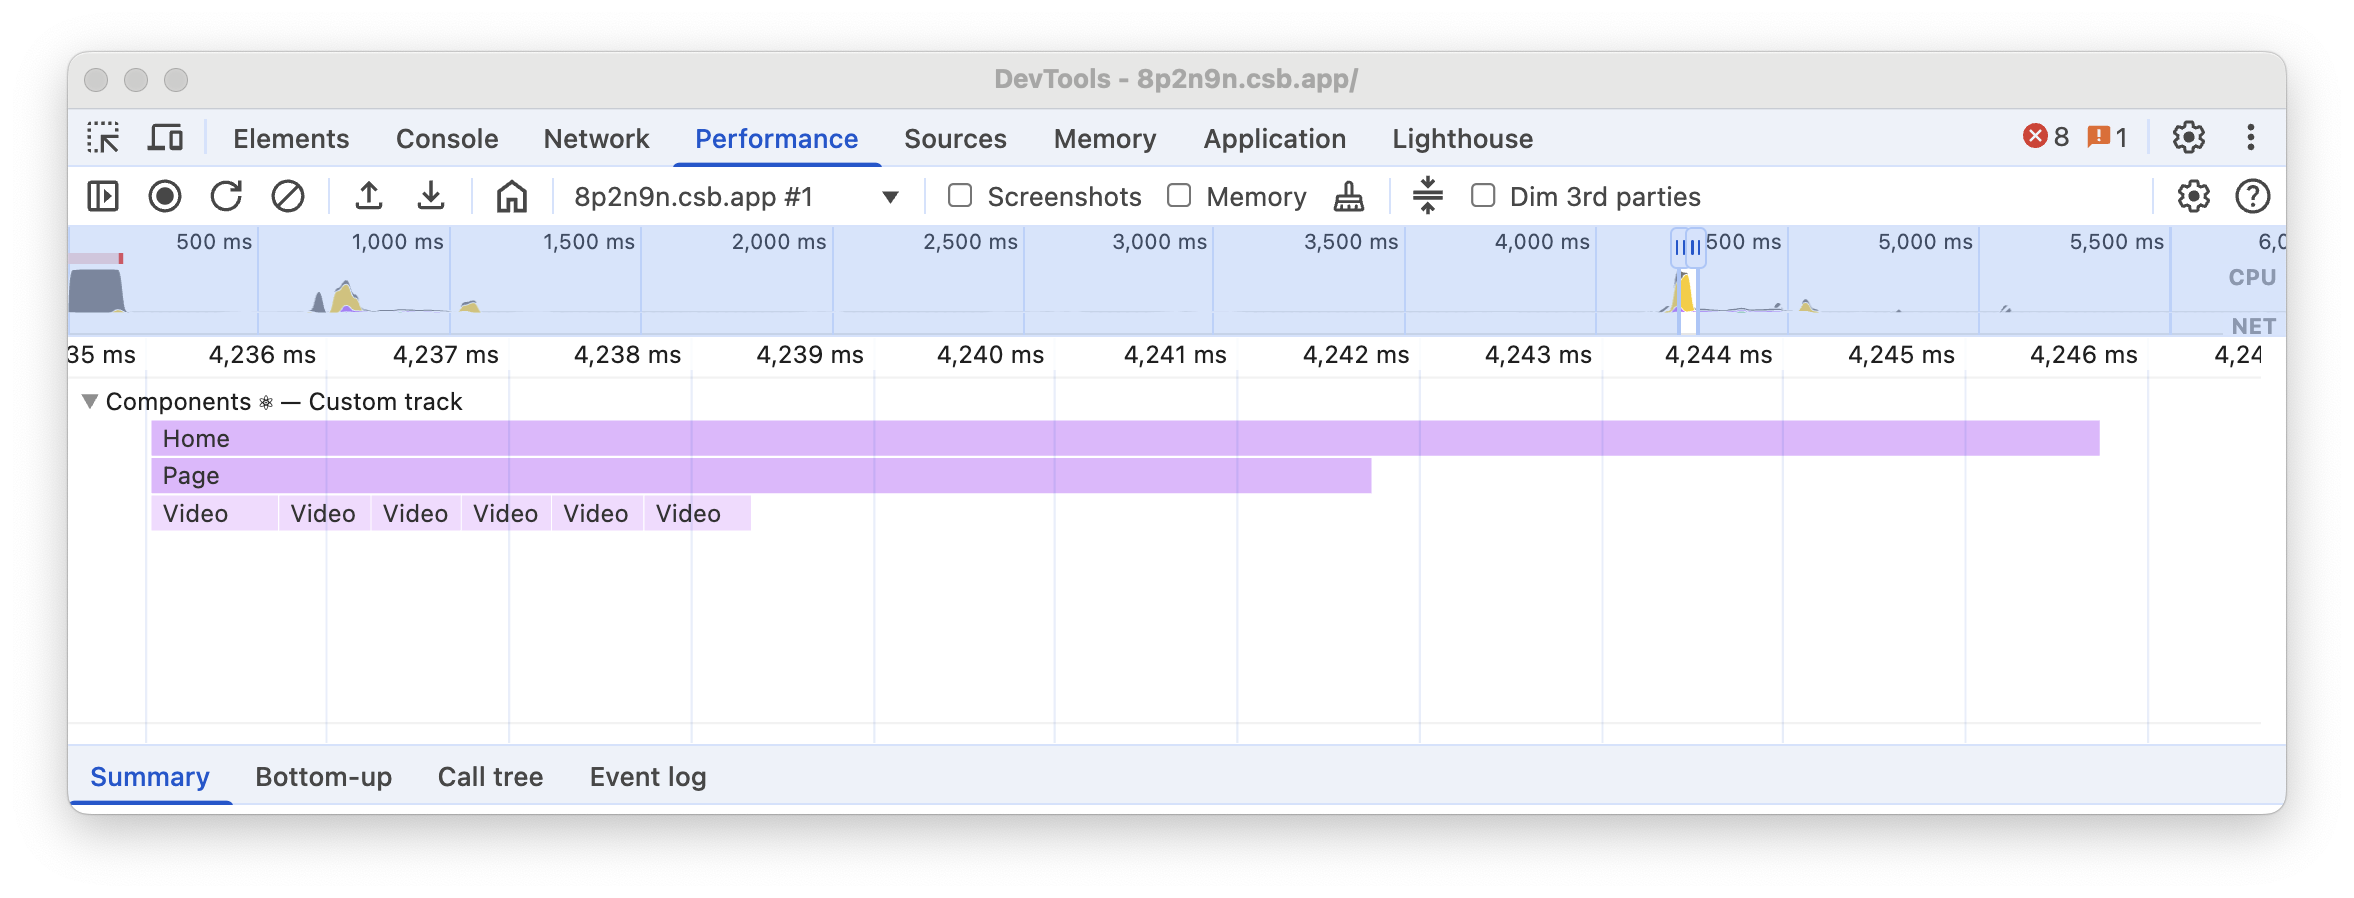
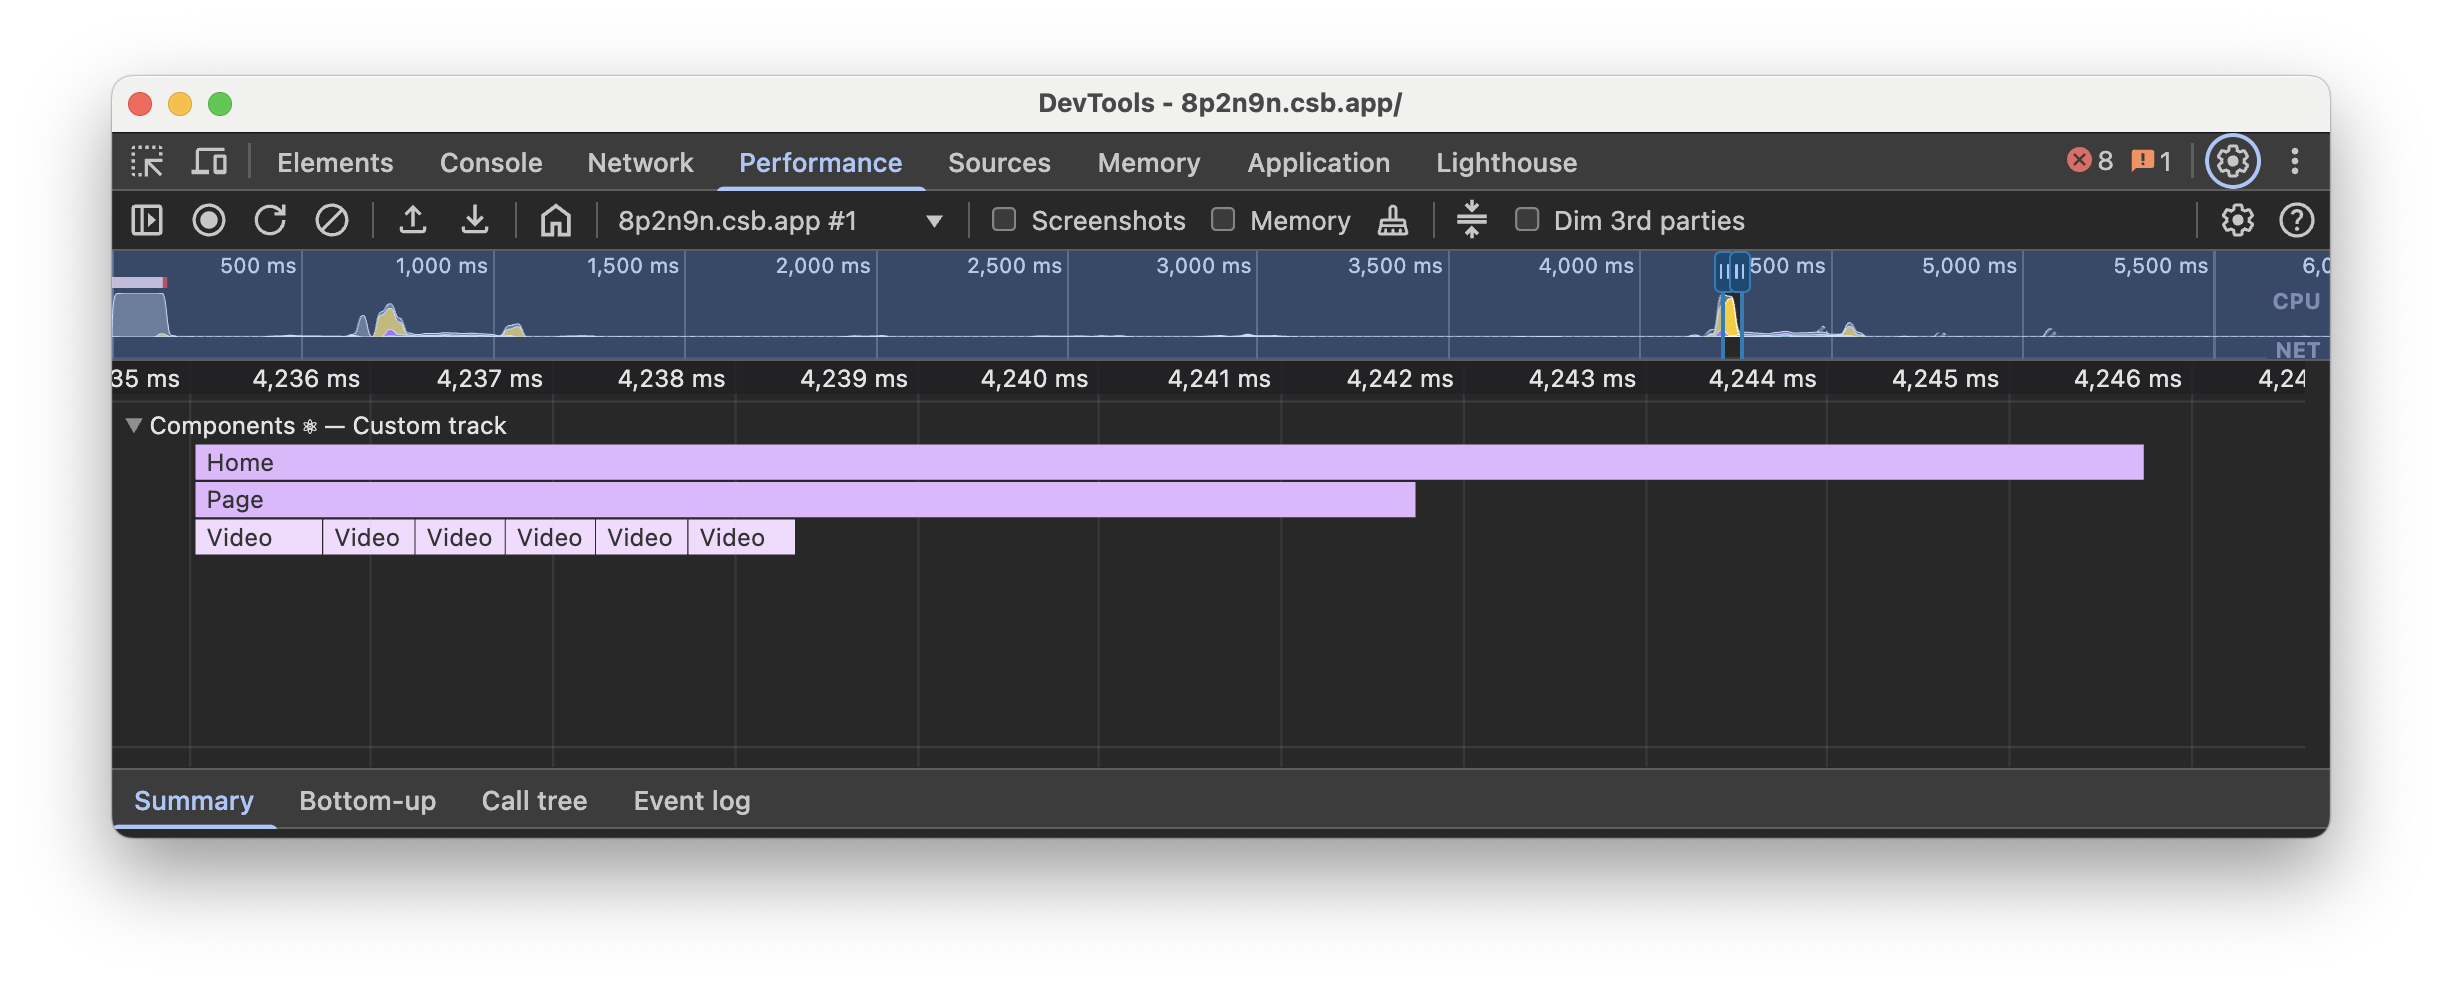
服务器组件跟踪可视化了 React 服务器组件 Promise 的等待时长。时间以火焰图的形式显示,每个条目表示相应组件渲染及其所有子组件的持续时间。
🌐 The Server Components tracks visualize the durations of React Server Components Promises they awaited. Timings are displayed as a flamegraph, where each entry represents the duration of the corresponding component render and all its descendant children components.
如果你等待一个 Promise,React 将显示该 Promise 的持续时间。要查看所有 I/O 操作,请使用服务器请求跟踪。
🌐 If you await a Promise, React will display duration of that Promise. To see all I/O operations, use the Server Requests track.
使用不同的颜色来表示组件渲染的持续时间。颜色越深,持续时间越长。
🌐 Different colors are used to indicate the duration of the component render. The darker the color, the longer the duration.
服务器组件跟踪组将始终包含一个“主”跟踪。如果 React 能够并发渲染服务器组件,它将显示额外的“并行”跟踪。如果同时渲染的服务器组件超过 8 个,React 将把它们与最后一个“并行”跟踪关联,而不是添加更多跟踪。
🌐 The Server Components track group will always contain a “Primary” track. If React is able to render Server Components concurrently, it will display addititional “Parallel” tracks. If more than 8 Server Components are rendered concurrently, React will associate them with the last “Parallel” track instead of adding more tracks.